create a CJA Connections configured with Website datasets AEP Demo - Website Interactions, AEP Demo - Website Registration, and AEP Demo - Call Center Interactions. The product of the exercise is an enabled connection required for the creation of Data Views
- Create a new CJA connection.
- Add Experience Platform datasets to the connection.
- Stitch together selected datasets in the connection.
- Configure the naming and streaming details and enable the CJA connection.
Task 1: Create a new CJA connection
- Log into the Experience Platform UI with Cloud credentials. The Landing Page of the Platform UIopens, as shown:
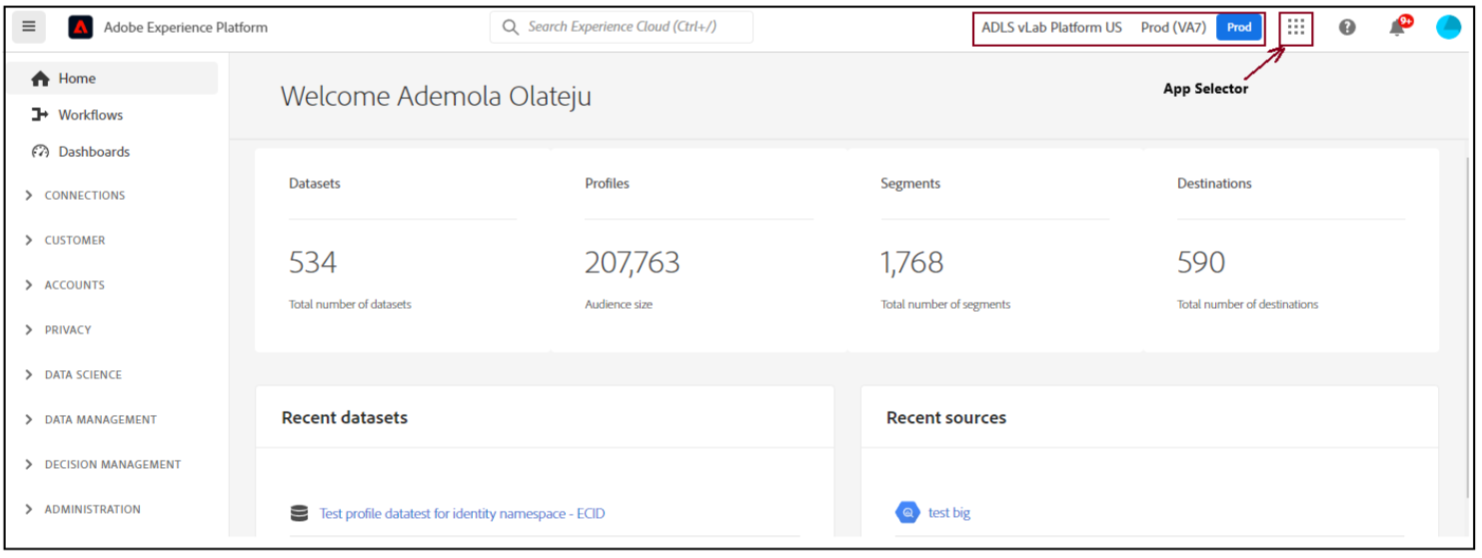
- Click the app selector icon at the upper- right corner and select Customer Journey Analytics. TheCustomer Journey Analytics page opens.
- Verify that you have access to Projects, Connections, Data Views and Components tabs on the top navigation bar, as shown:
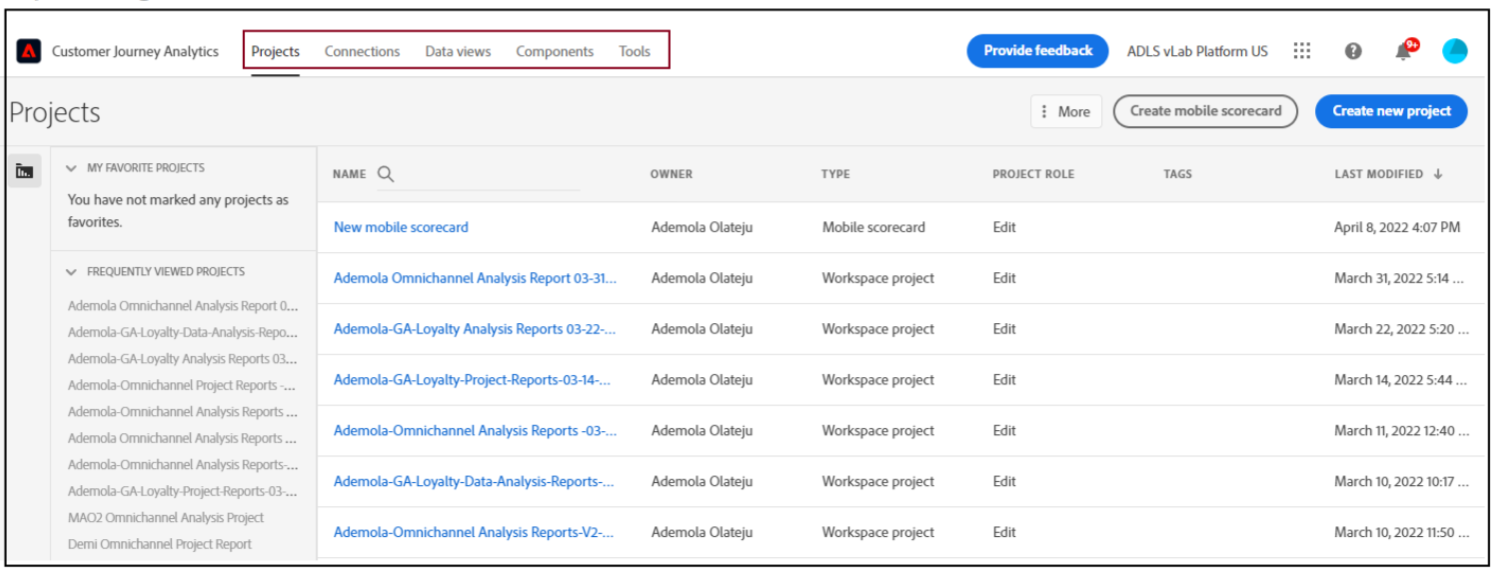
- Click the Connections tab to view the available connections.
- Click Create new Connection. The Create connection page opens. The page is categorized into three different sections, as shown:
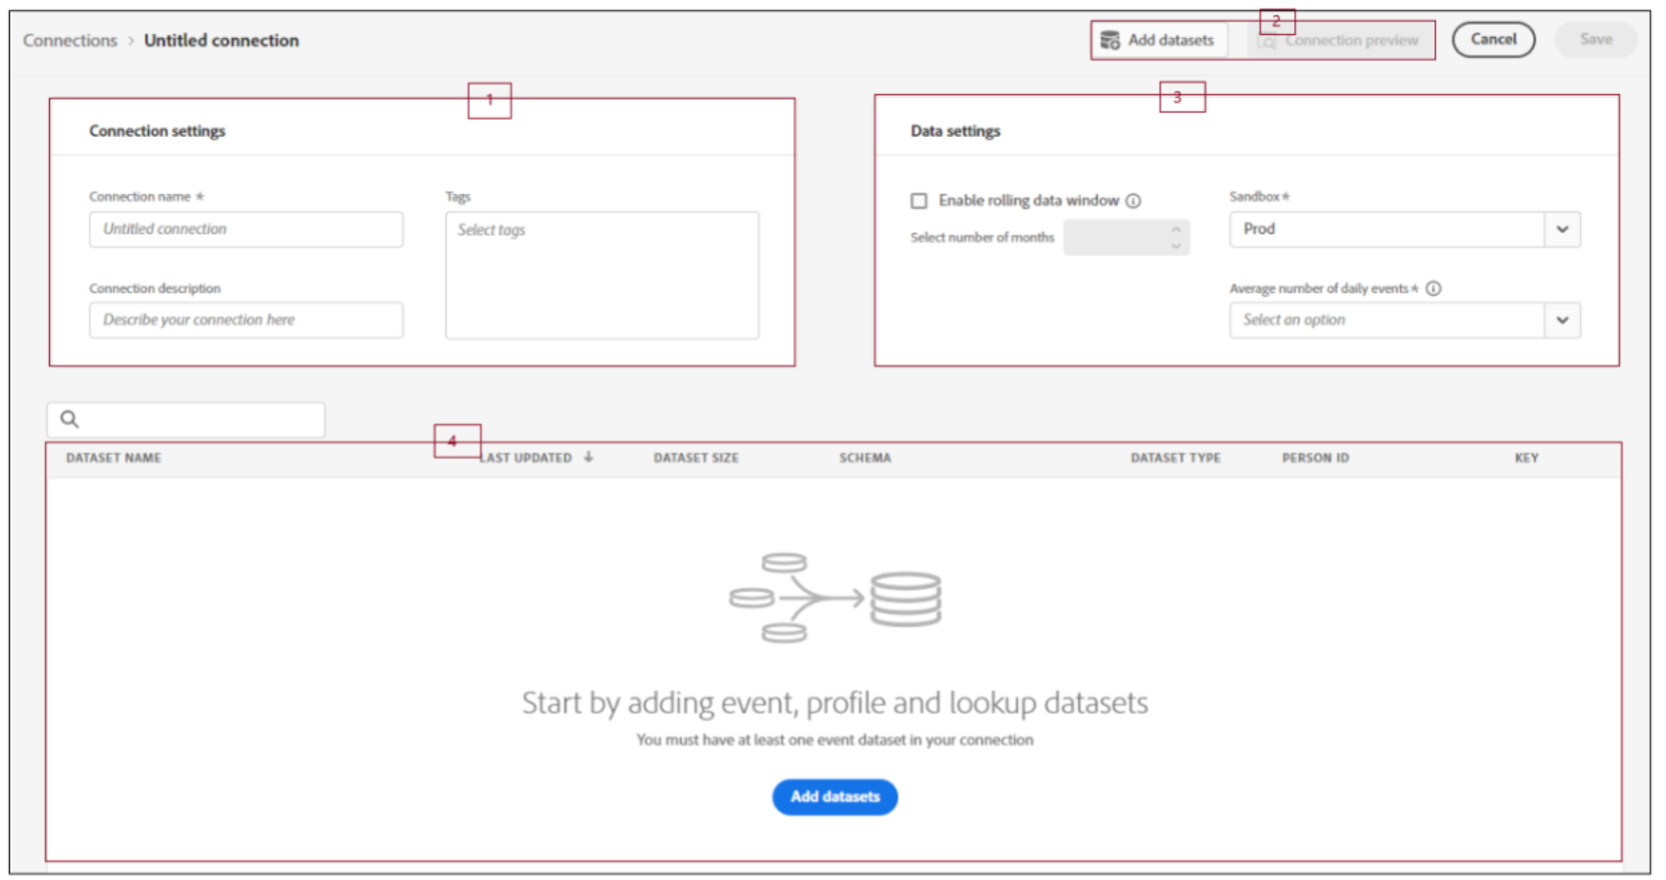
There are four different areas in the CJA Connection Configuration:
-
Connection Settings
- Name: Required
- Description: Optional but Recommended
- ags: Optional
-
dd datasets: Lists of available Experience Platform datasets.
-
Data setting.
- Enable rolling data window: Allows you to Define data retention as a rolling window in months at a connection level.
- Select number of months: Allows you delete older data and retain latest months dataSpecified by the number of months
- Sandbox: The AEP Org containing data to be use
- Average number of daily events: Select a range for the number of expected daily events for the entire connection.
-
Dataset list details: Add and Configure datasets in a connection
Task 2: Configure the CJA Connection
-
Provide the details of the Connection settings section, as shown:
- Name: Omnichannel Data Connection-PROD- MMDDYYYY. For example, AMO – Omnichannel Data Connection- PROD-04202022.
- Description (Optional): In the Description box, type a description for the connection. In this case, simply use the name as the description, i.e. Omnichannel DataConnection- PROD-04202022
-
Configure the Data setting as follows:
- Enable rolling data window: Unchecked
- Sandbox: Prod
- Average number of daily events: less than 1 million
-
Add the datasets to the connection using the steps below:
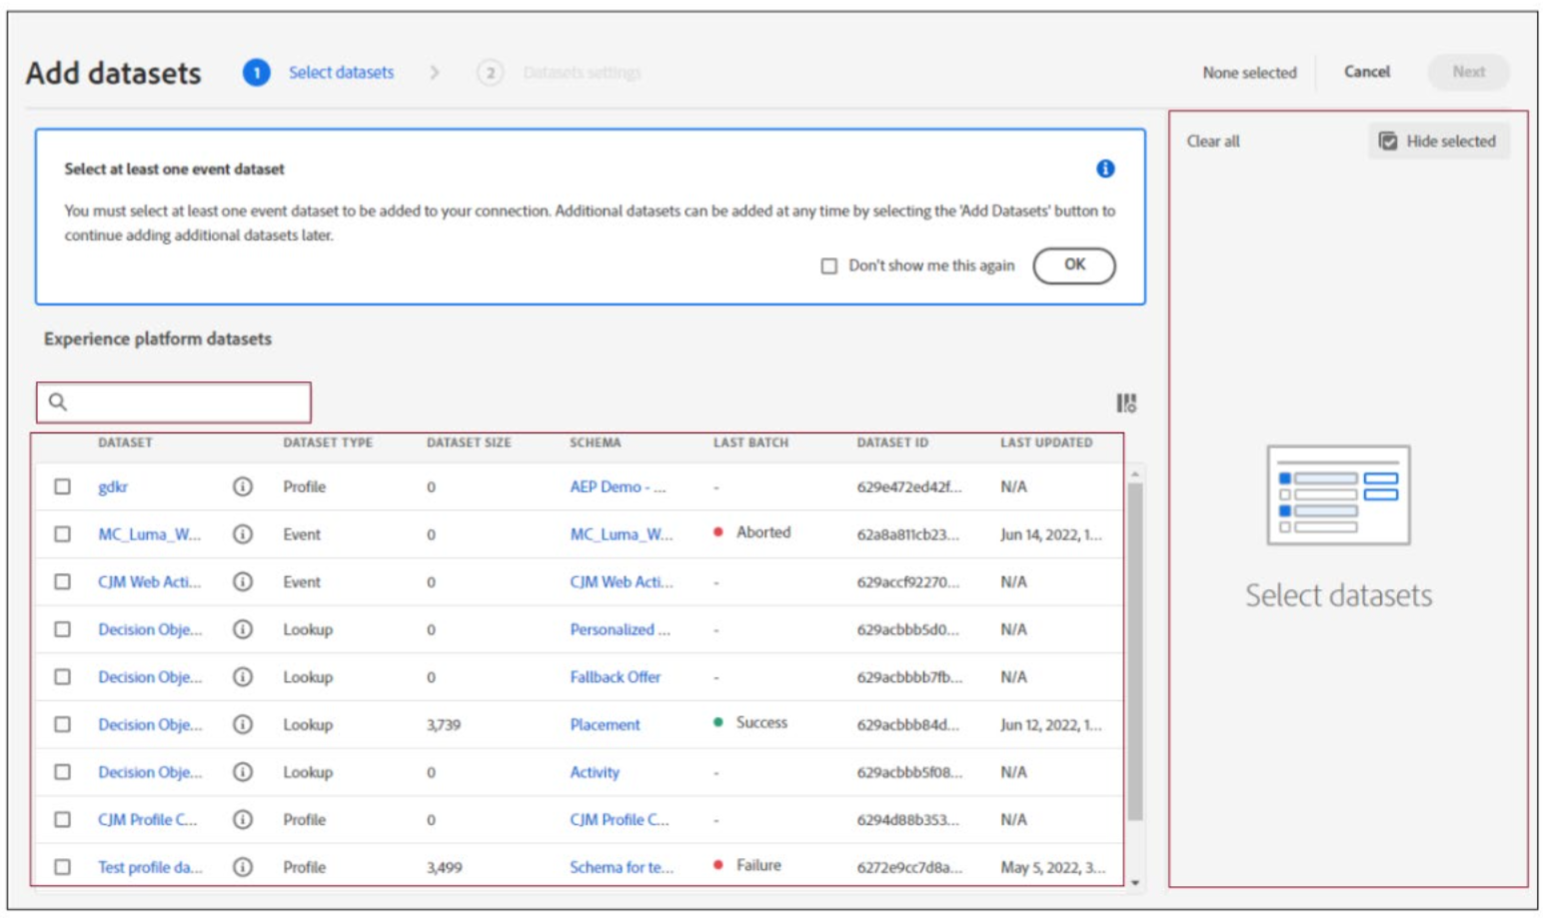
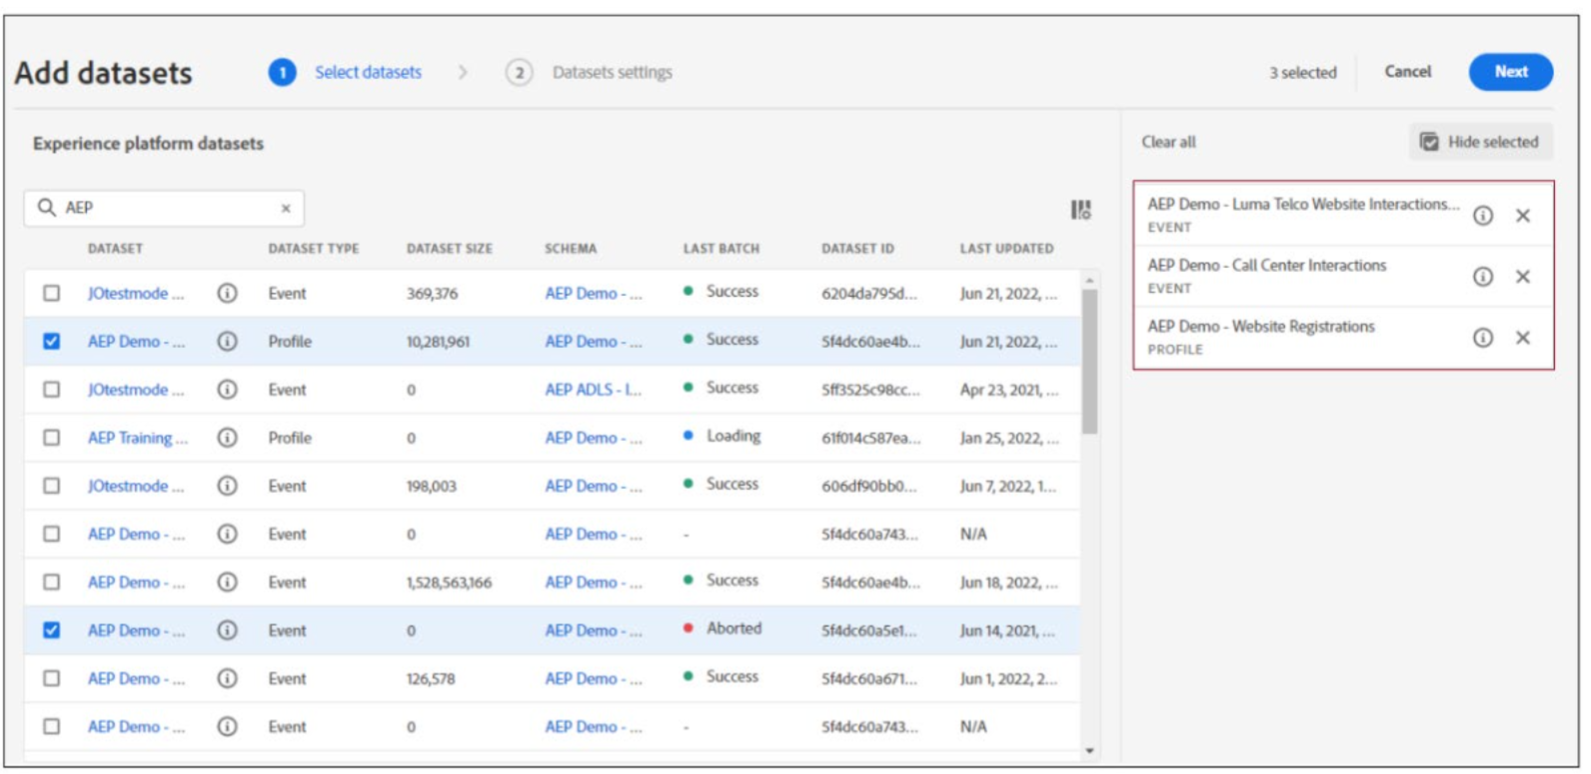
- Click Add datasets on the top right corner o r click Add datasets button in the Dataset list window. An Add dataset windows opens, as shown:
-
Search for and select the following datasets to the CJA Connection
- AEP Demo Luma Telco Website Interactions
- AEP Demo Website Registration
- AEP Demo Call Center Interactions
The CJA Connection with the selected dataset is as shown:
-
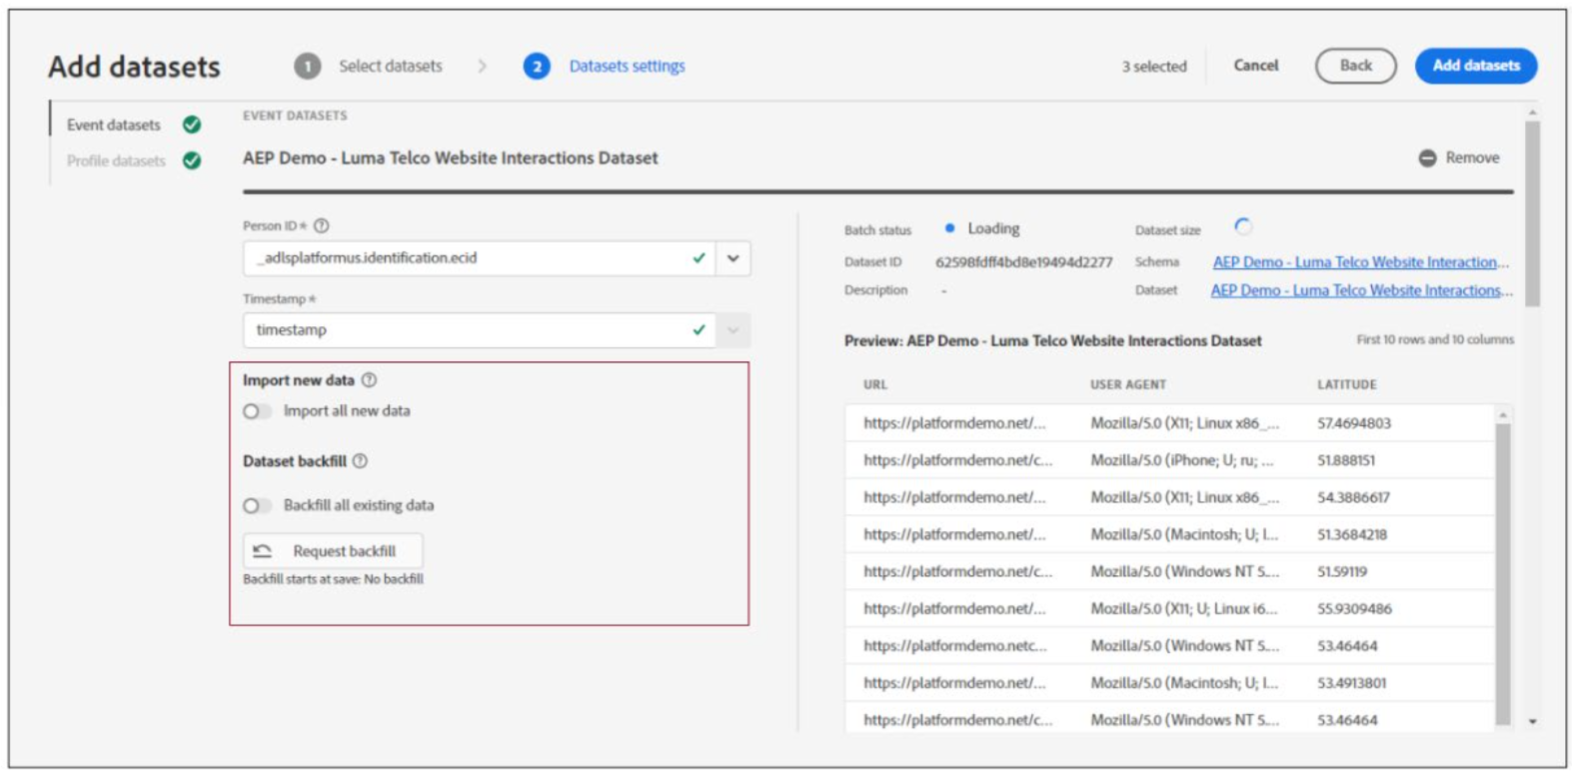
Click Next to continue to the Dataset setting phase, as show:
-
Enable Import all new data and Backfill all existing data for all datasets in the connection.
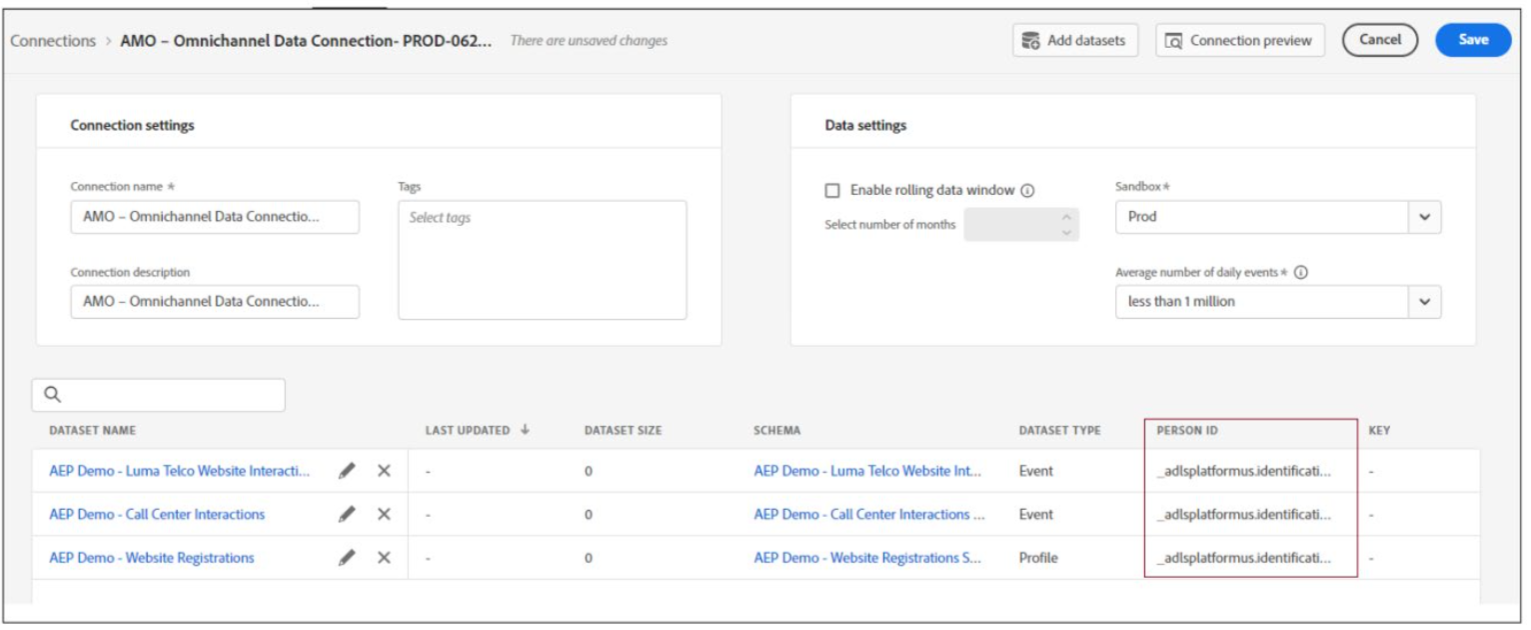
Click Add dataset to return to the CJA Connection settings, as shown:
-
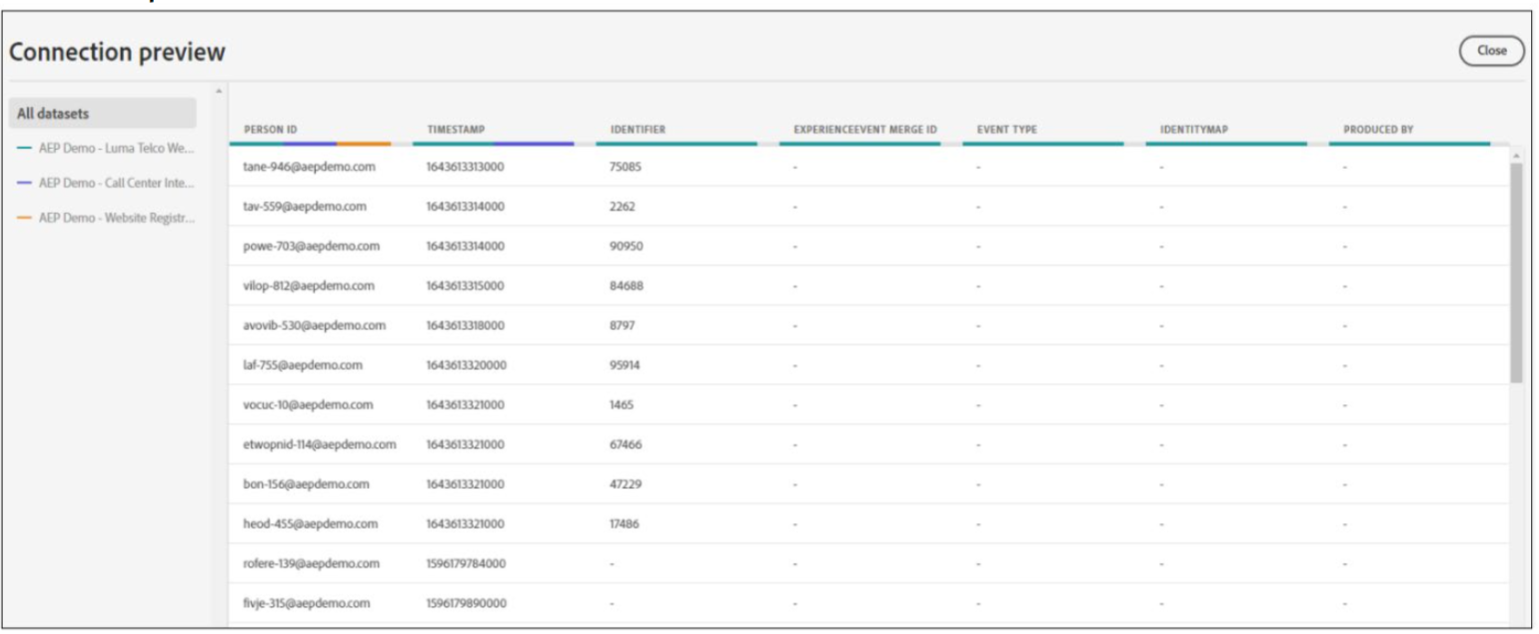
Click Connection preview button on the top right corner. The combined data from the selected dataset opens, as shown:
-
Review and close the Connection preview window.
-
Click Save to save the CJA Connection configuration.
-
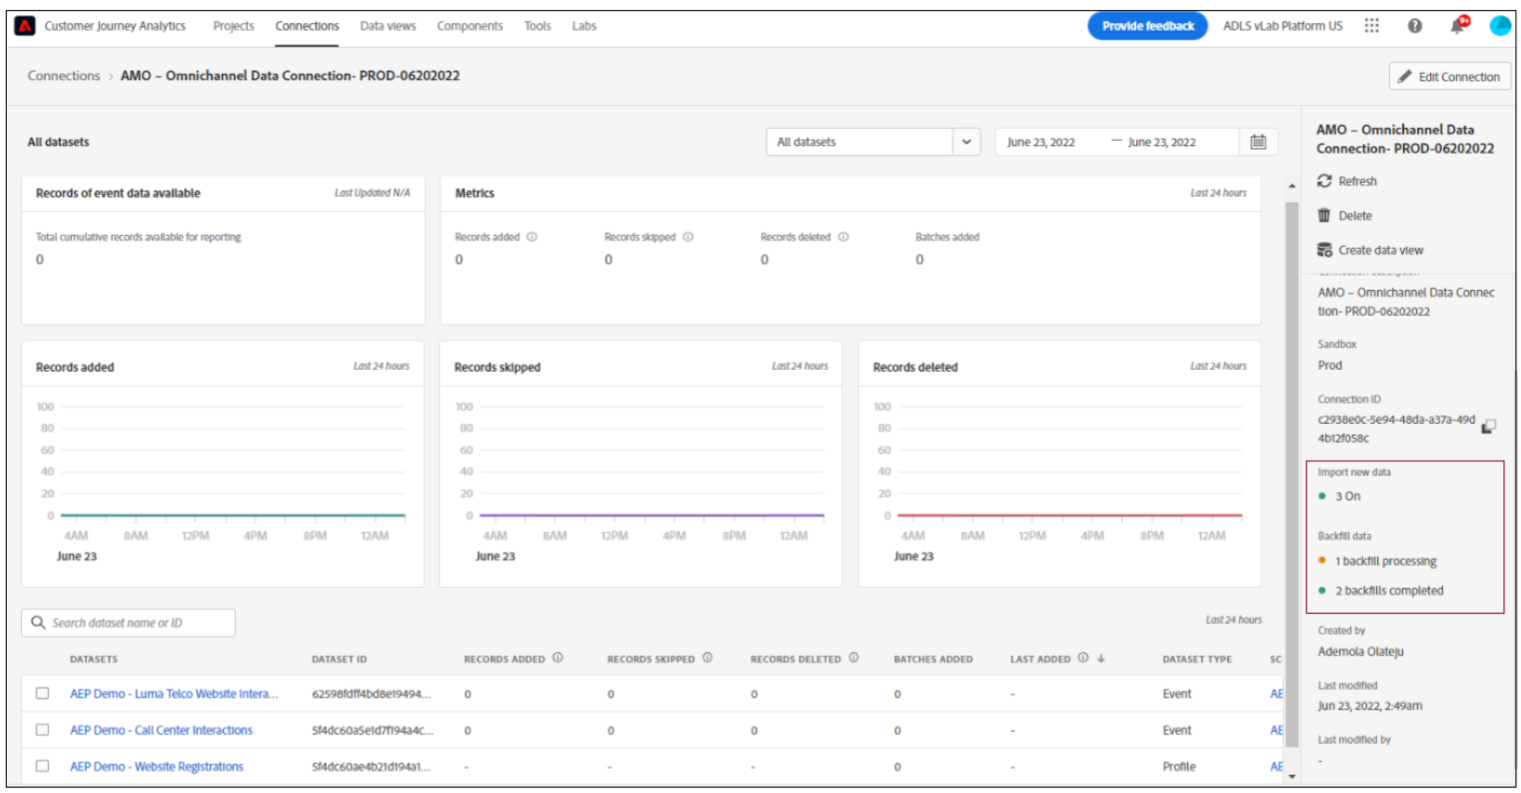
Close the No Support.. Window Overly. The Connection Manager opens, as shown:
Note:
Backfill historical data
Import all existing data lets you backfill historical data. Keep this in mind:
- We have removed the backfill (historical data import) limitation. Previously, you could backfill a maximum of 2.5 billion rows on your own and otherwise required engineering involvement. Now,you can backfill data on your own, without any limitations.
- We prioritize new data added to a dataset in the connection, so this new data has the lowest latency.
- Any backfill (historical) data is imported at a slower rate. The latency is influenced by how much historical data you have, combined with the Average number of daily events  setting you selected.For example, if you have more than one billion rows of data per day, plus 3 years of historical data,that could take multiple weeks to import. On the other hand, if you have less than a million rows per day and one week of historical data, that would take less than an hour.
- Backfilling applies to the whole connection, not to each dataset individually.
- The  Adobe Analytics Source Connector  imports up to 13 months of data, irrespective of size.
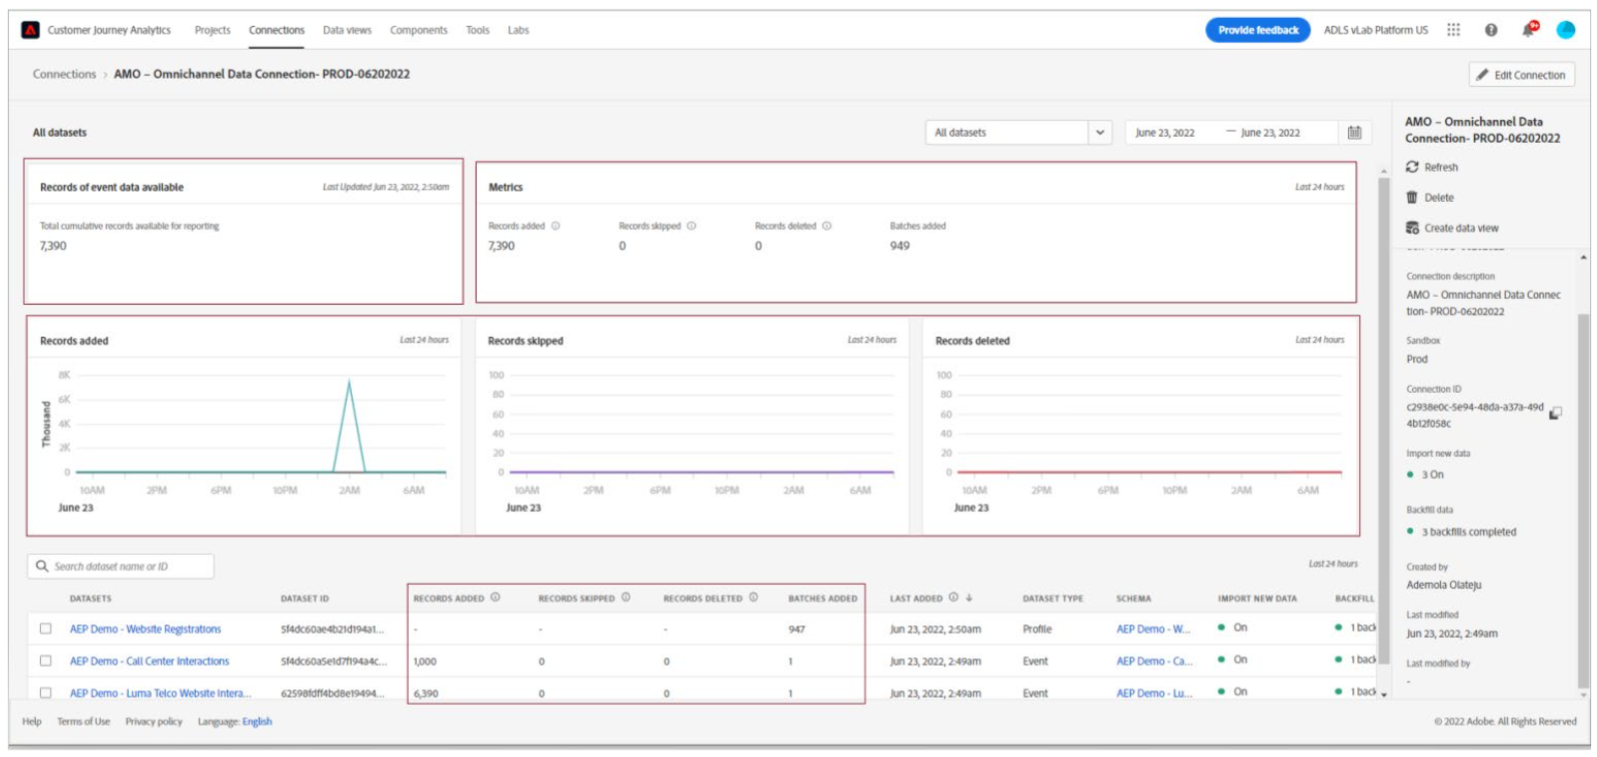
Data Available for Reporting
- There is a latency of 1- 2 hours to get the data to appear in reporting once it is added.
- Represents the total number of event dataset rows available for reporting, for the entire connection.This count is independent of any calendar settings.
- You can Refresh and check the status Backfill data, as shown:
Click the Connection Link on the top right corner or the Menu bar of the screen to return to theCreate New Connection window, as shown:
