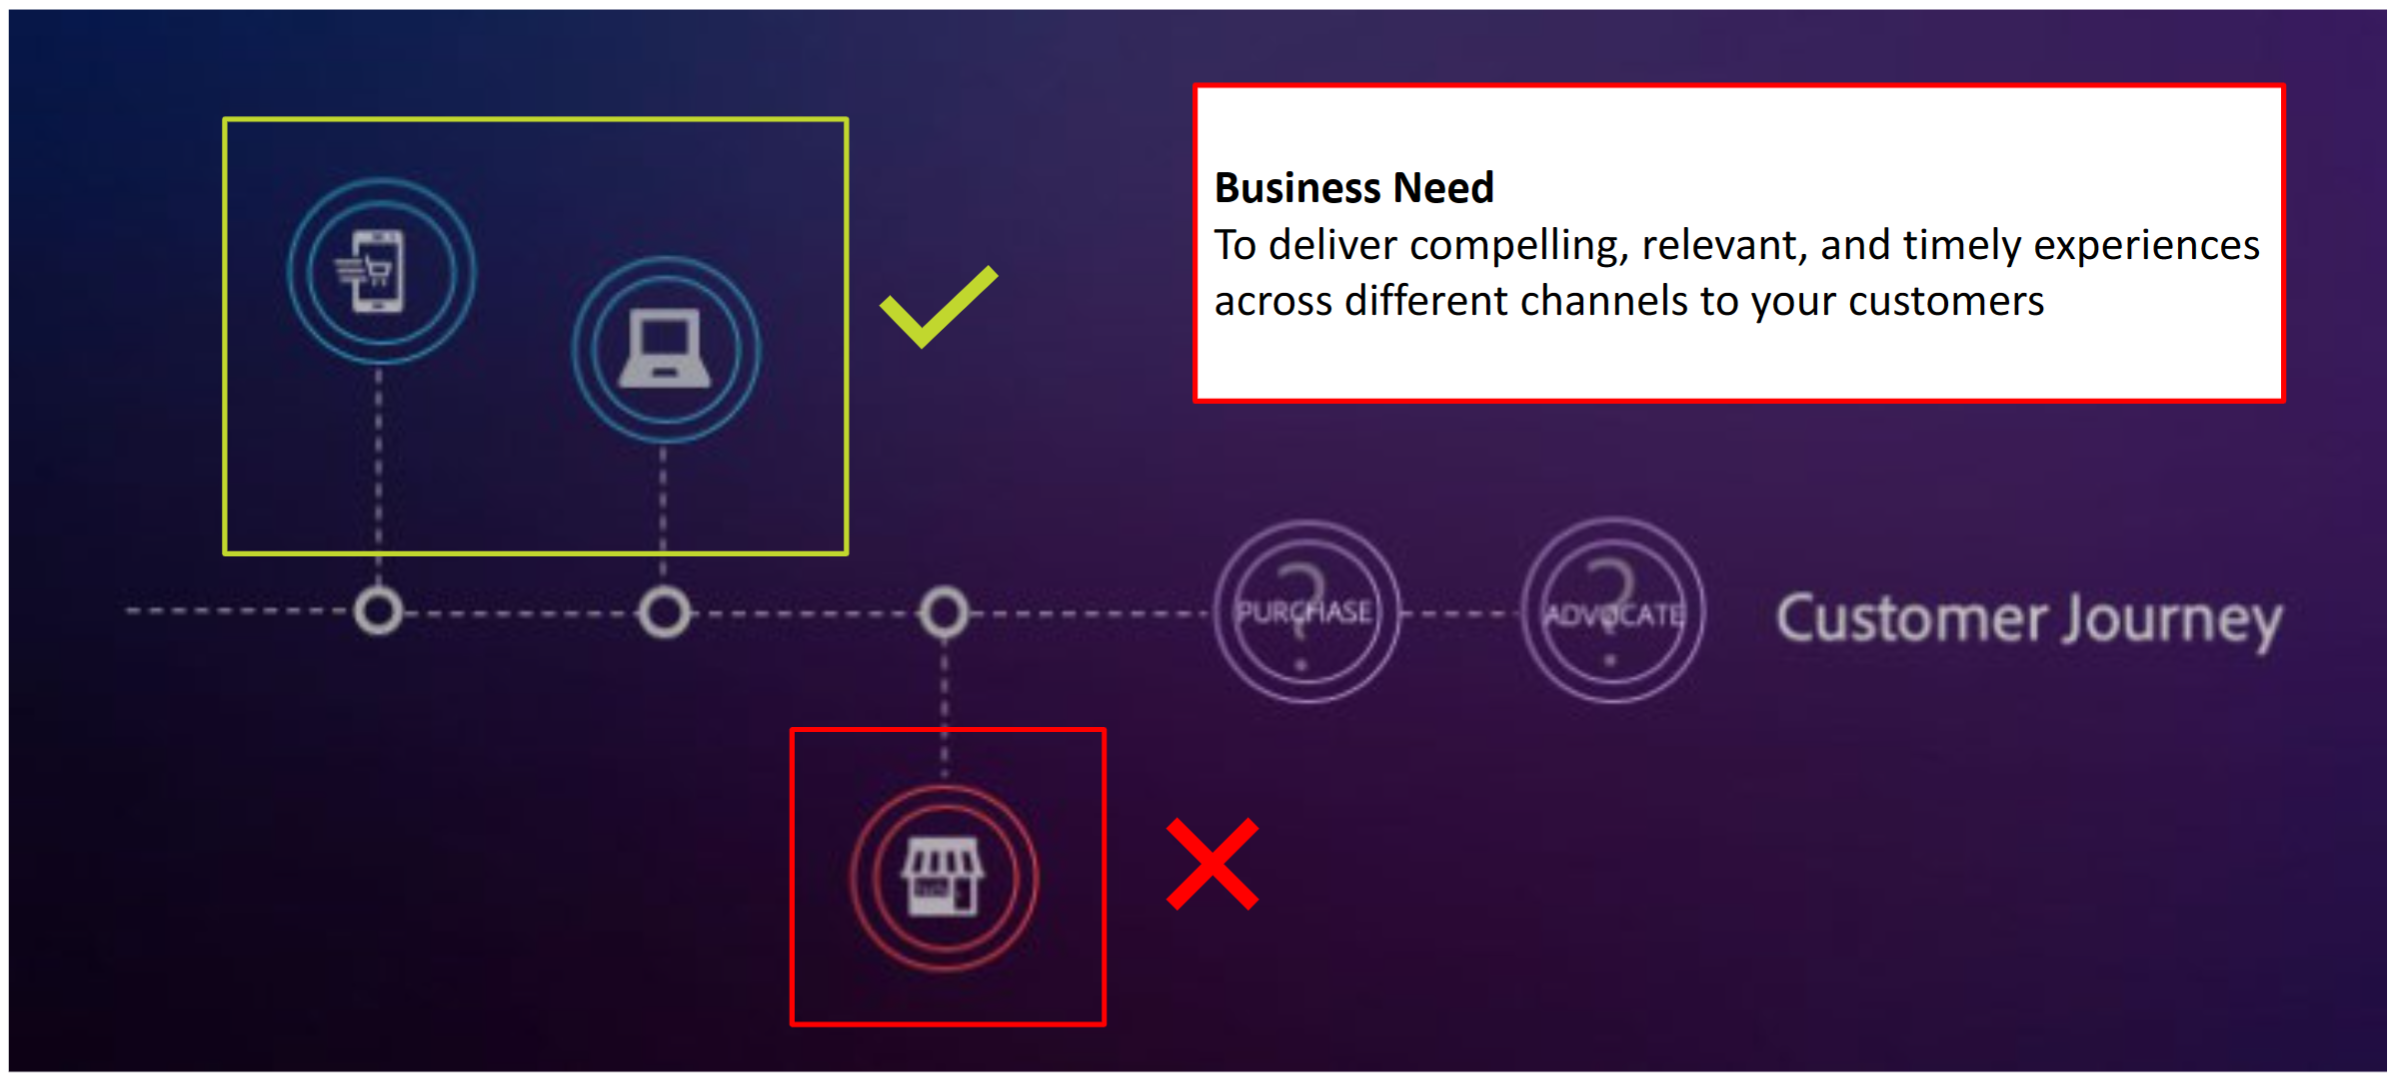
Business Need
Traditional BI Framework: Limitations
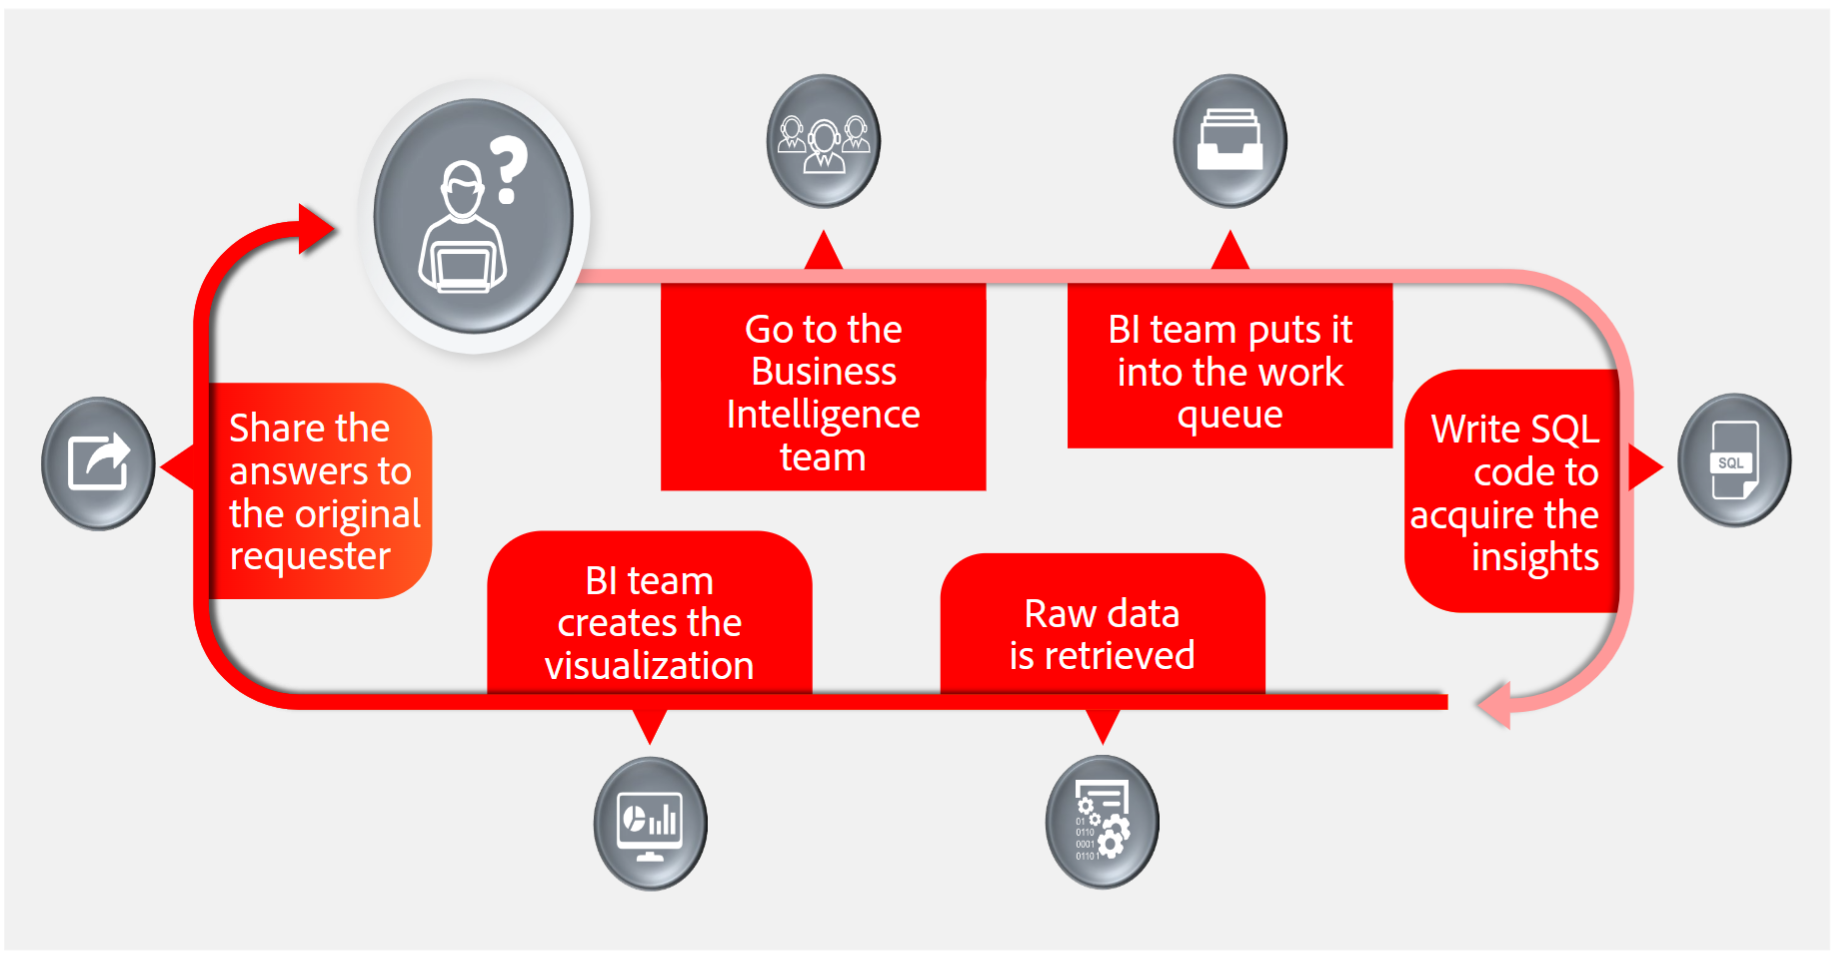
- Business users do not know the questions ahead of time.
- Insights and decisions are found in the process of discovery.
- Many users can not write queries but need deep-dive insights.
Why Adobe Customer Journey Analytics?
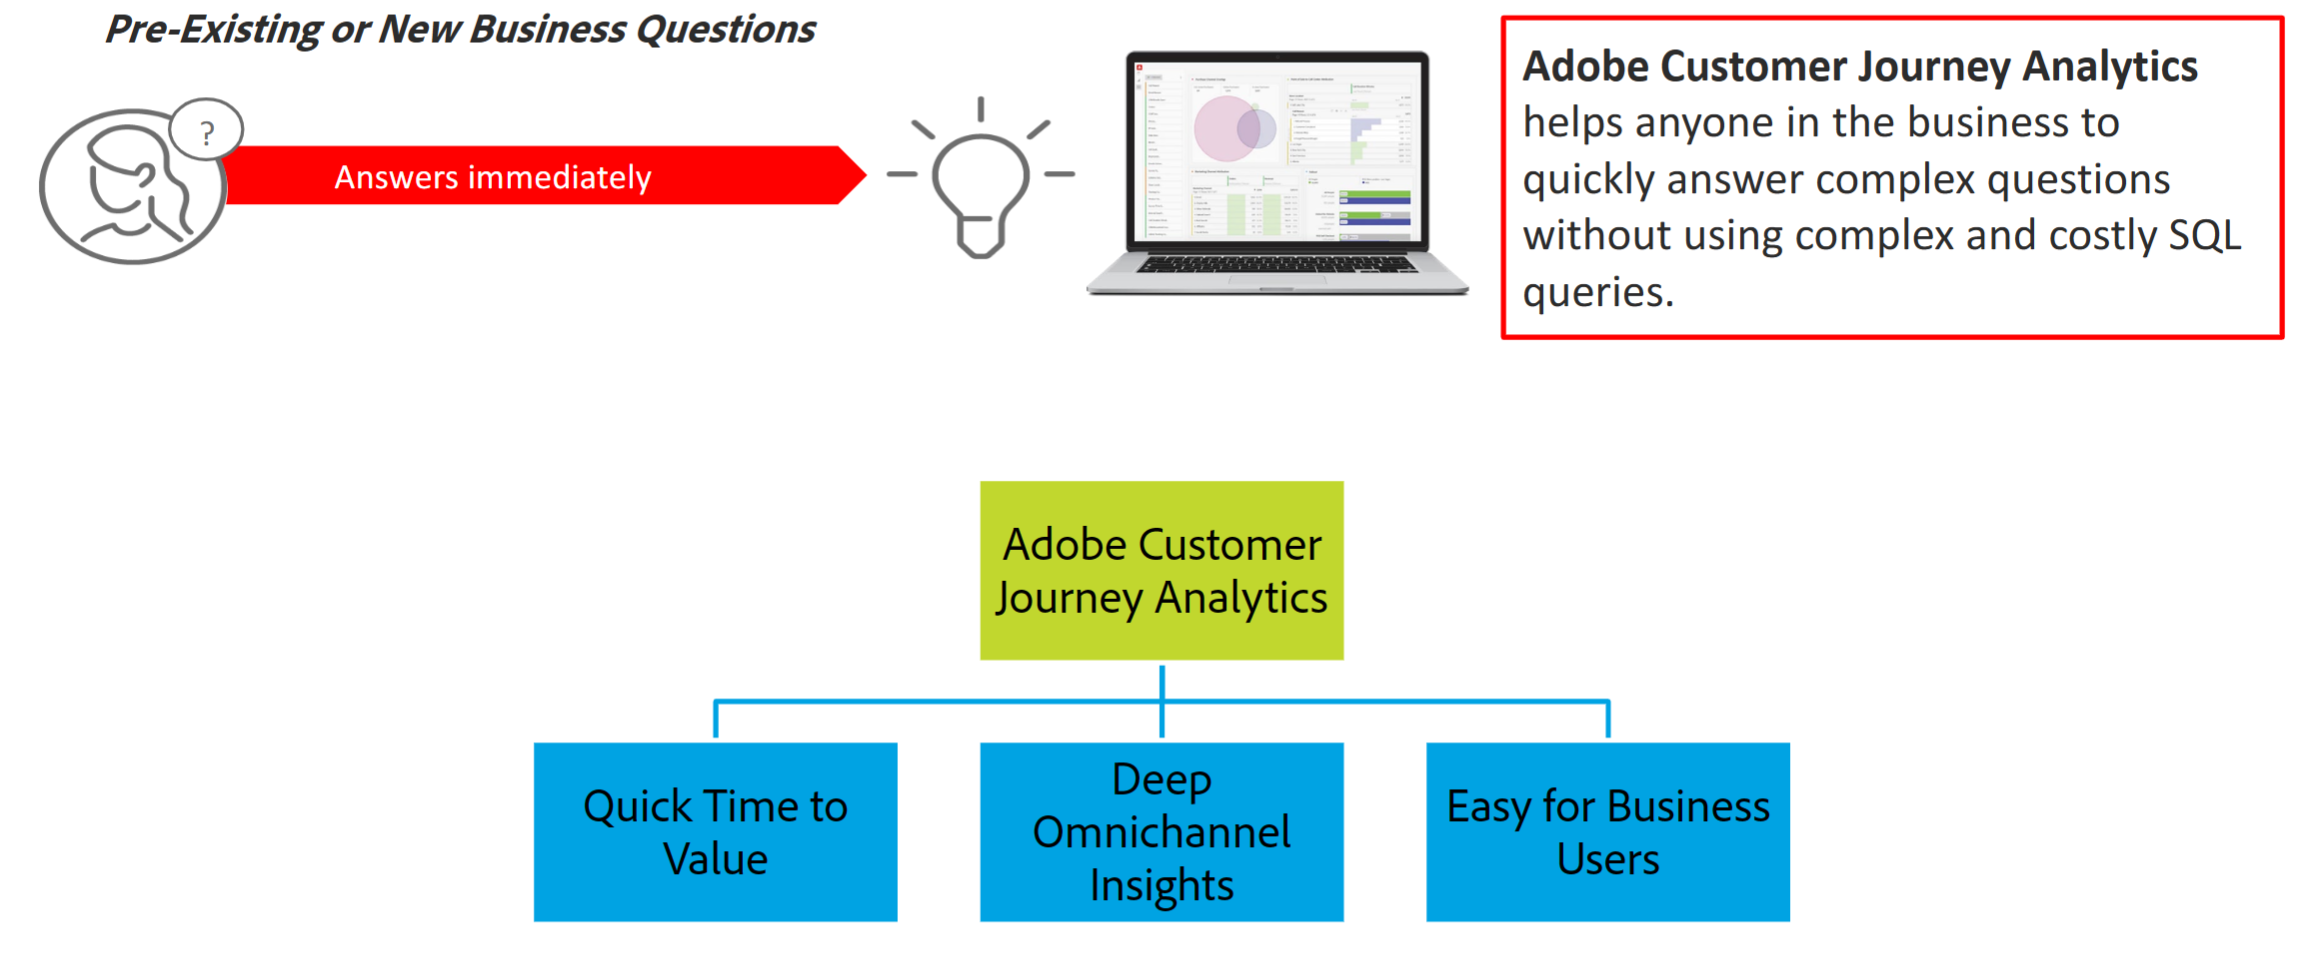
Adobe Customer Journey Analytics - Use Cases

Adobe Customer Journey Analytics vs. Adobe Analytics

Use Adobe Customer Journey Analytics for:
- Multi channel data, such as call center or offline.
- Data from larger ecosystem, such as Adobe Experience Platform.
- Versatile architecture to collect and enrich data.
- Cross channel attribution.
Data Processing in Analytics and Customer Journey Analytics
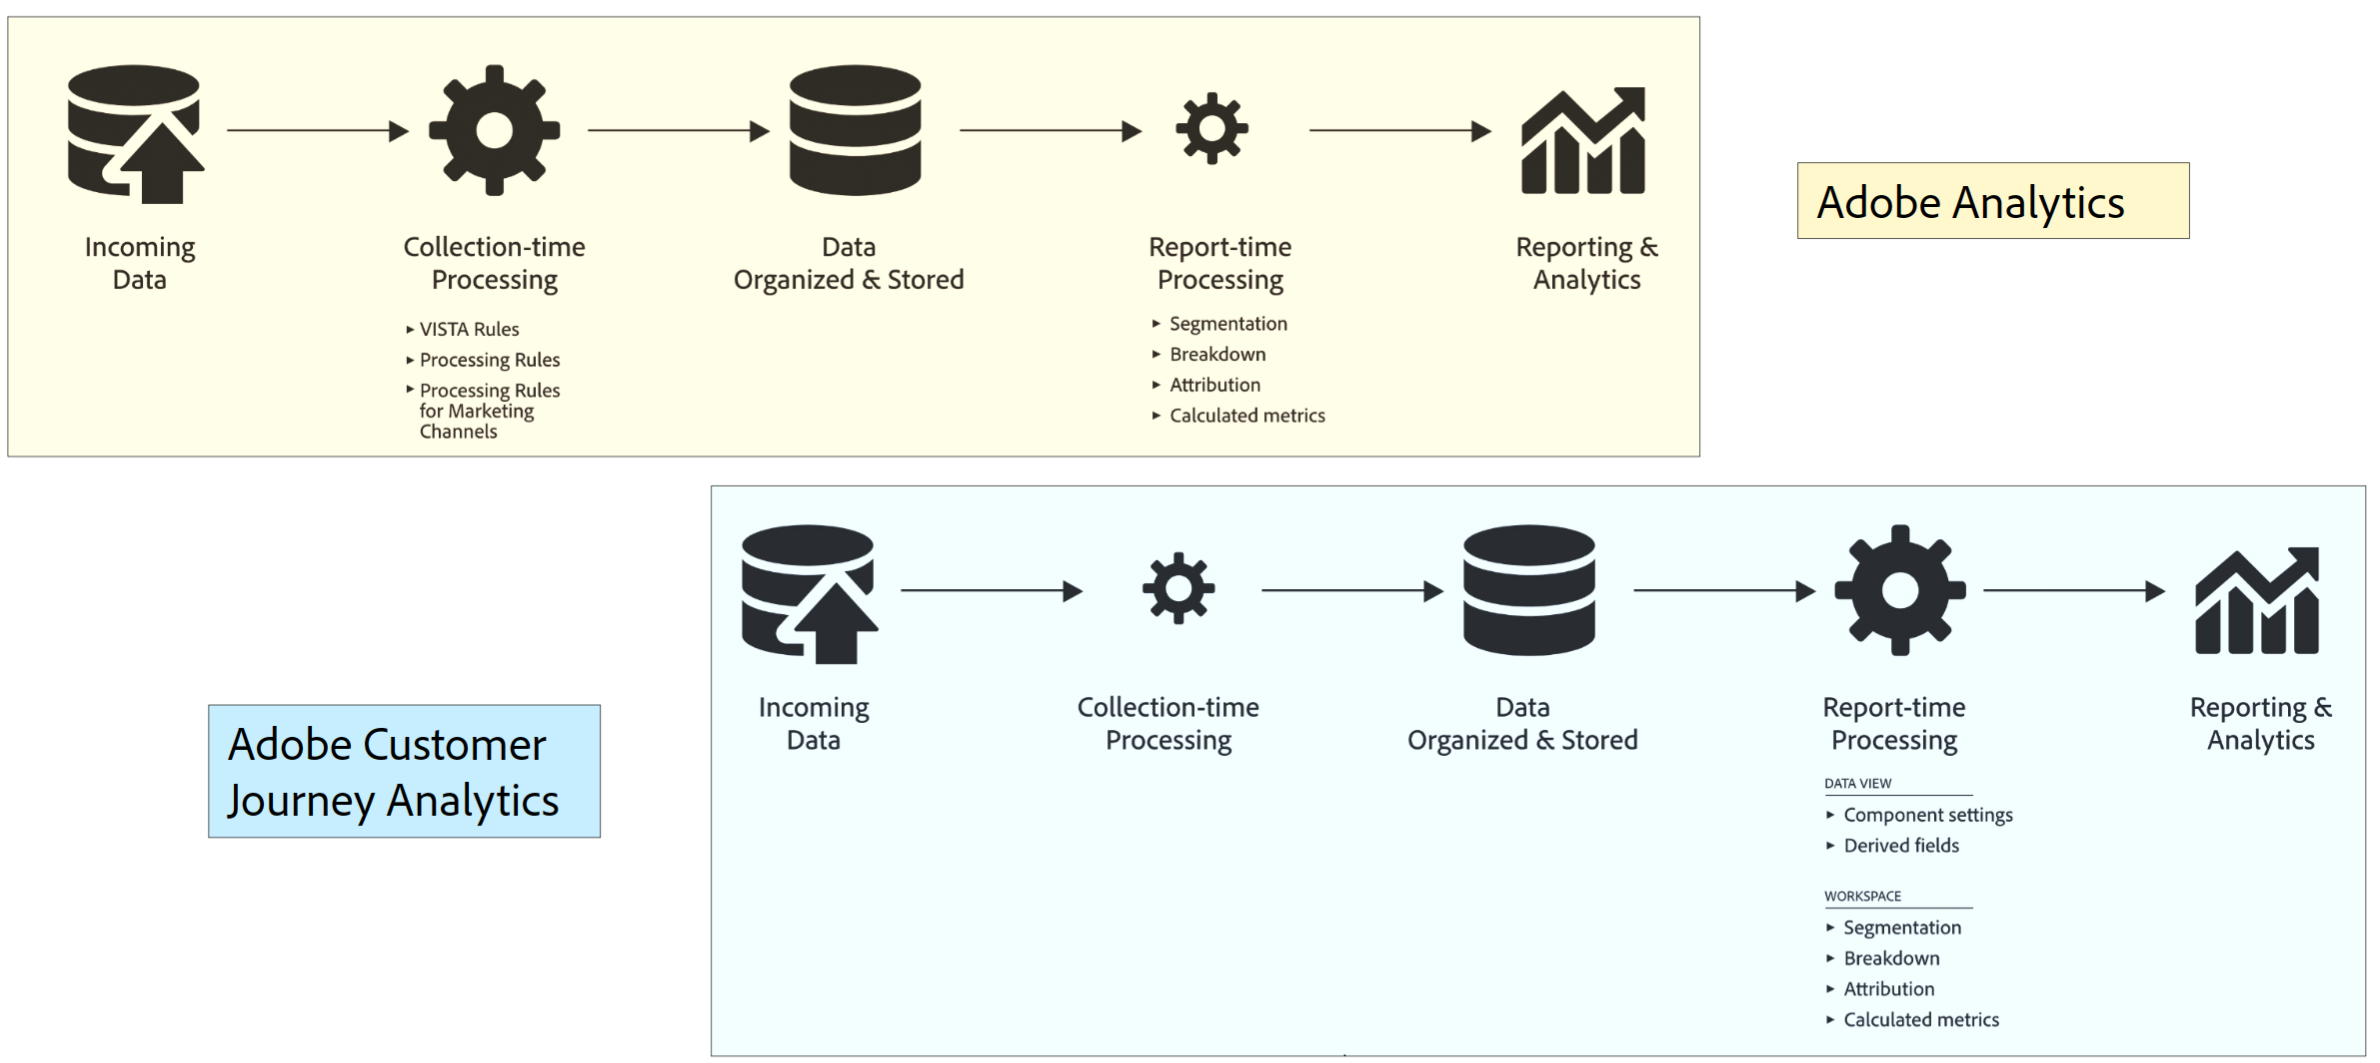
Adobe Customer Journey Analytics System
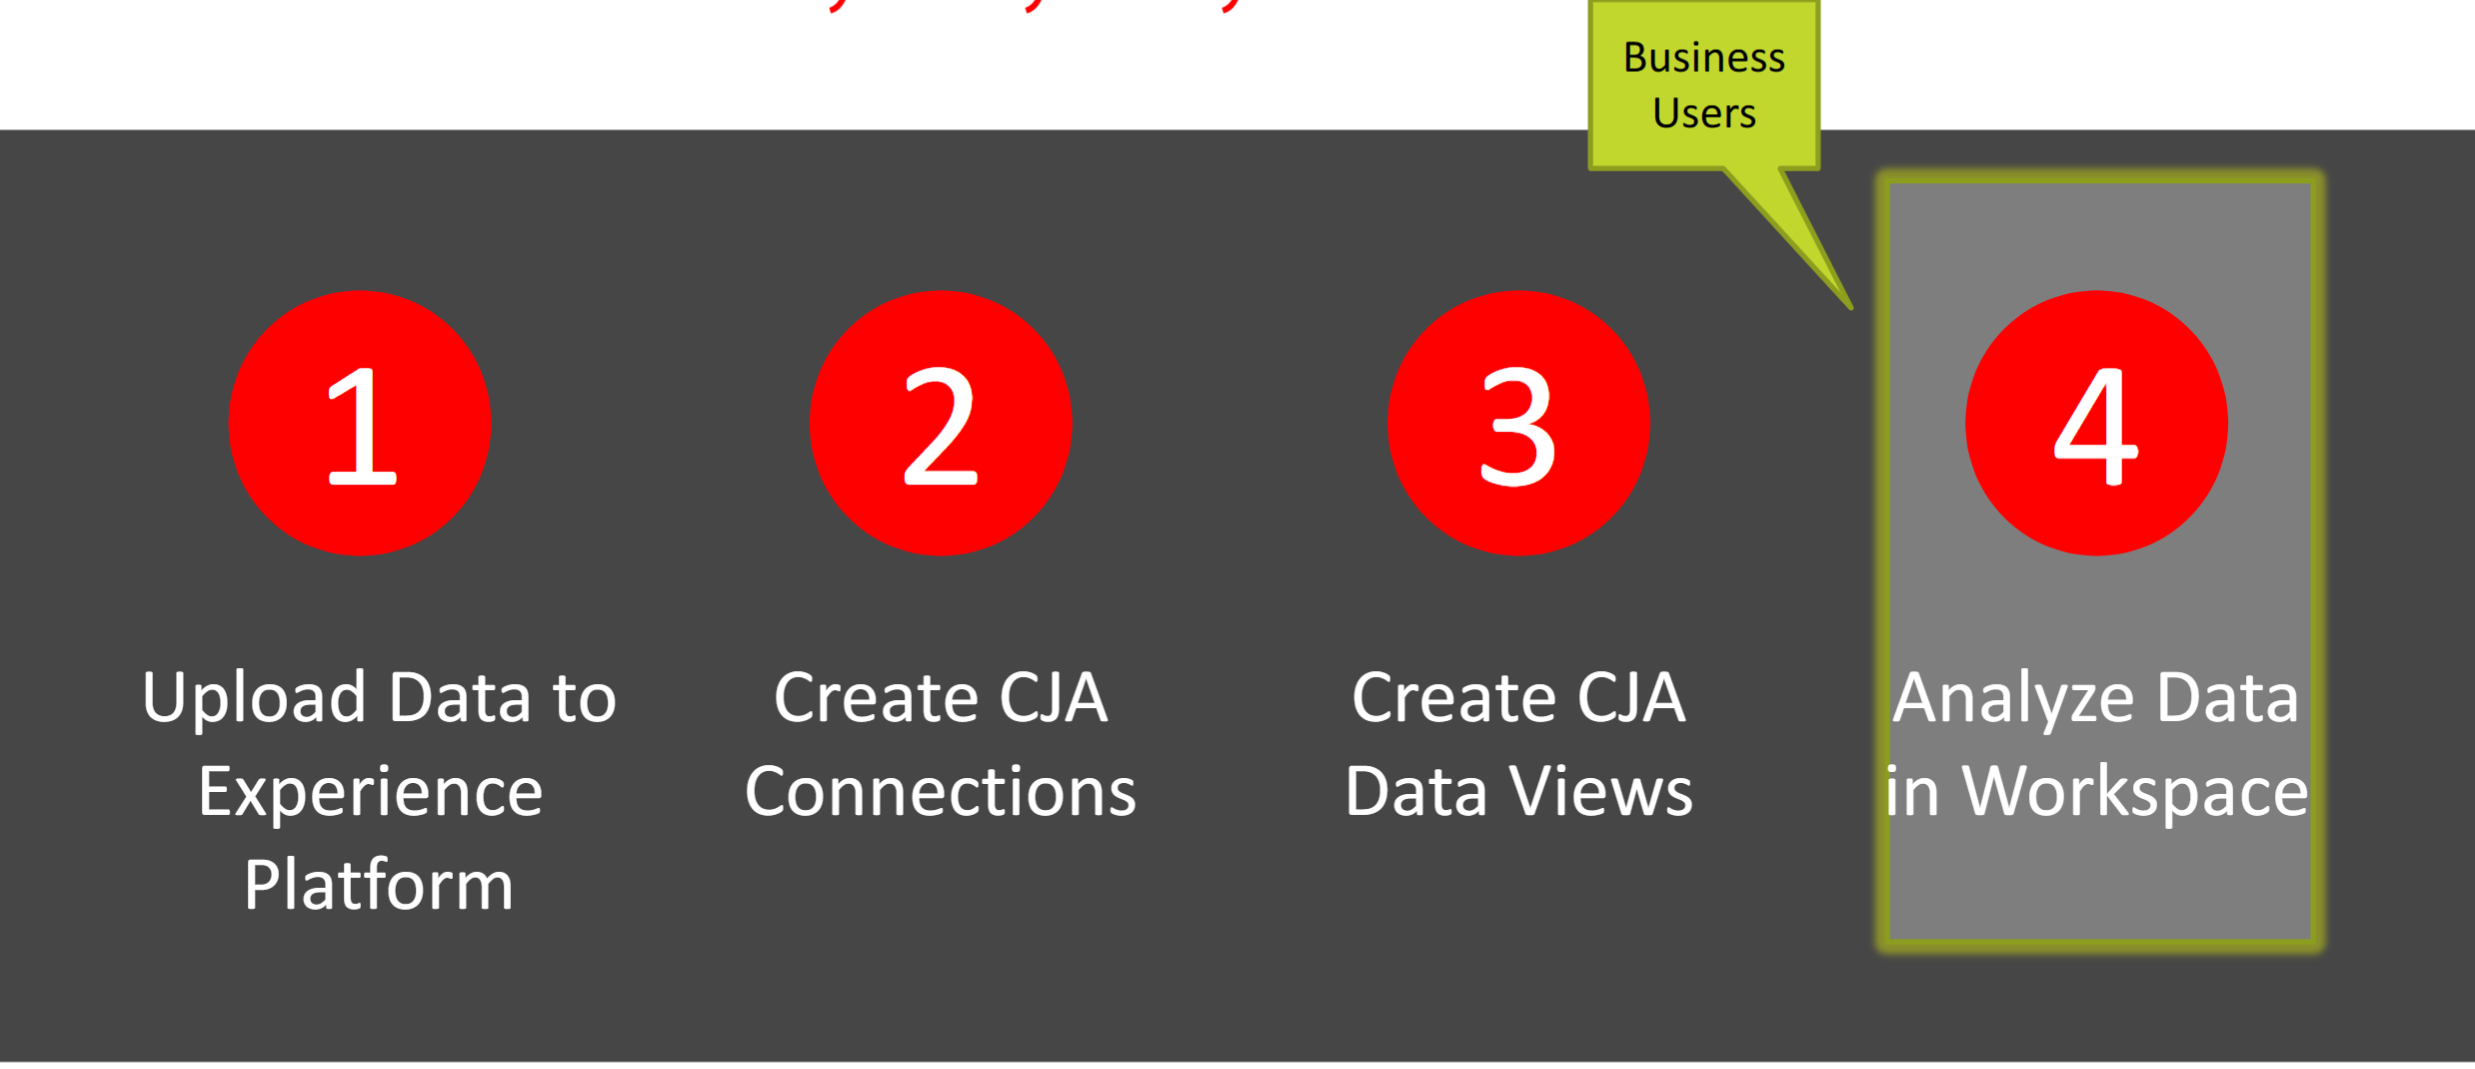
What is Adobe Customer Journey Analytics?
An application that:
- Is built on Experience Platform.
- Brings Analysis Workspace capabilities in Experience Platform.
- Contextualizes and visualizes data.
- Stitches online and offline data together to create analysis reports.
- Delivers context & clarity to the complex multi-channel journey.
Adobe Customer Journey Analytics | Benefits
- See the customer in the context of a complete journey across channels.
- Make insights available to everyone.
- Harness the power of data science for your analysts.
- Visualize and interact with your datasets using ad-hoc reporting.
- View non web data with digital data.
- Exert greater control over your data customization.
Adobe Experience Cloud Architecture

Customer Journey Analytics Data Flow with Experience Platform
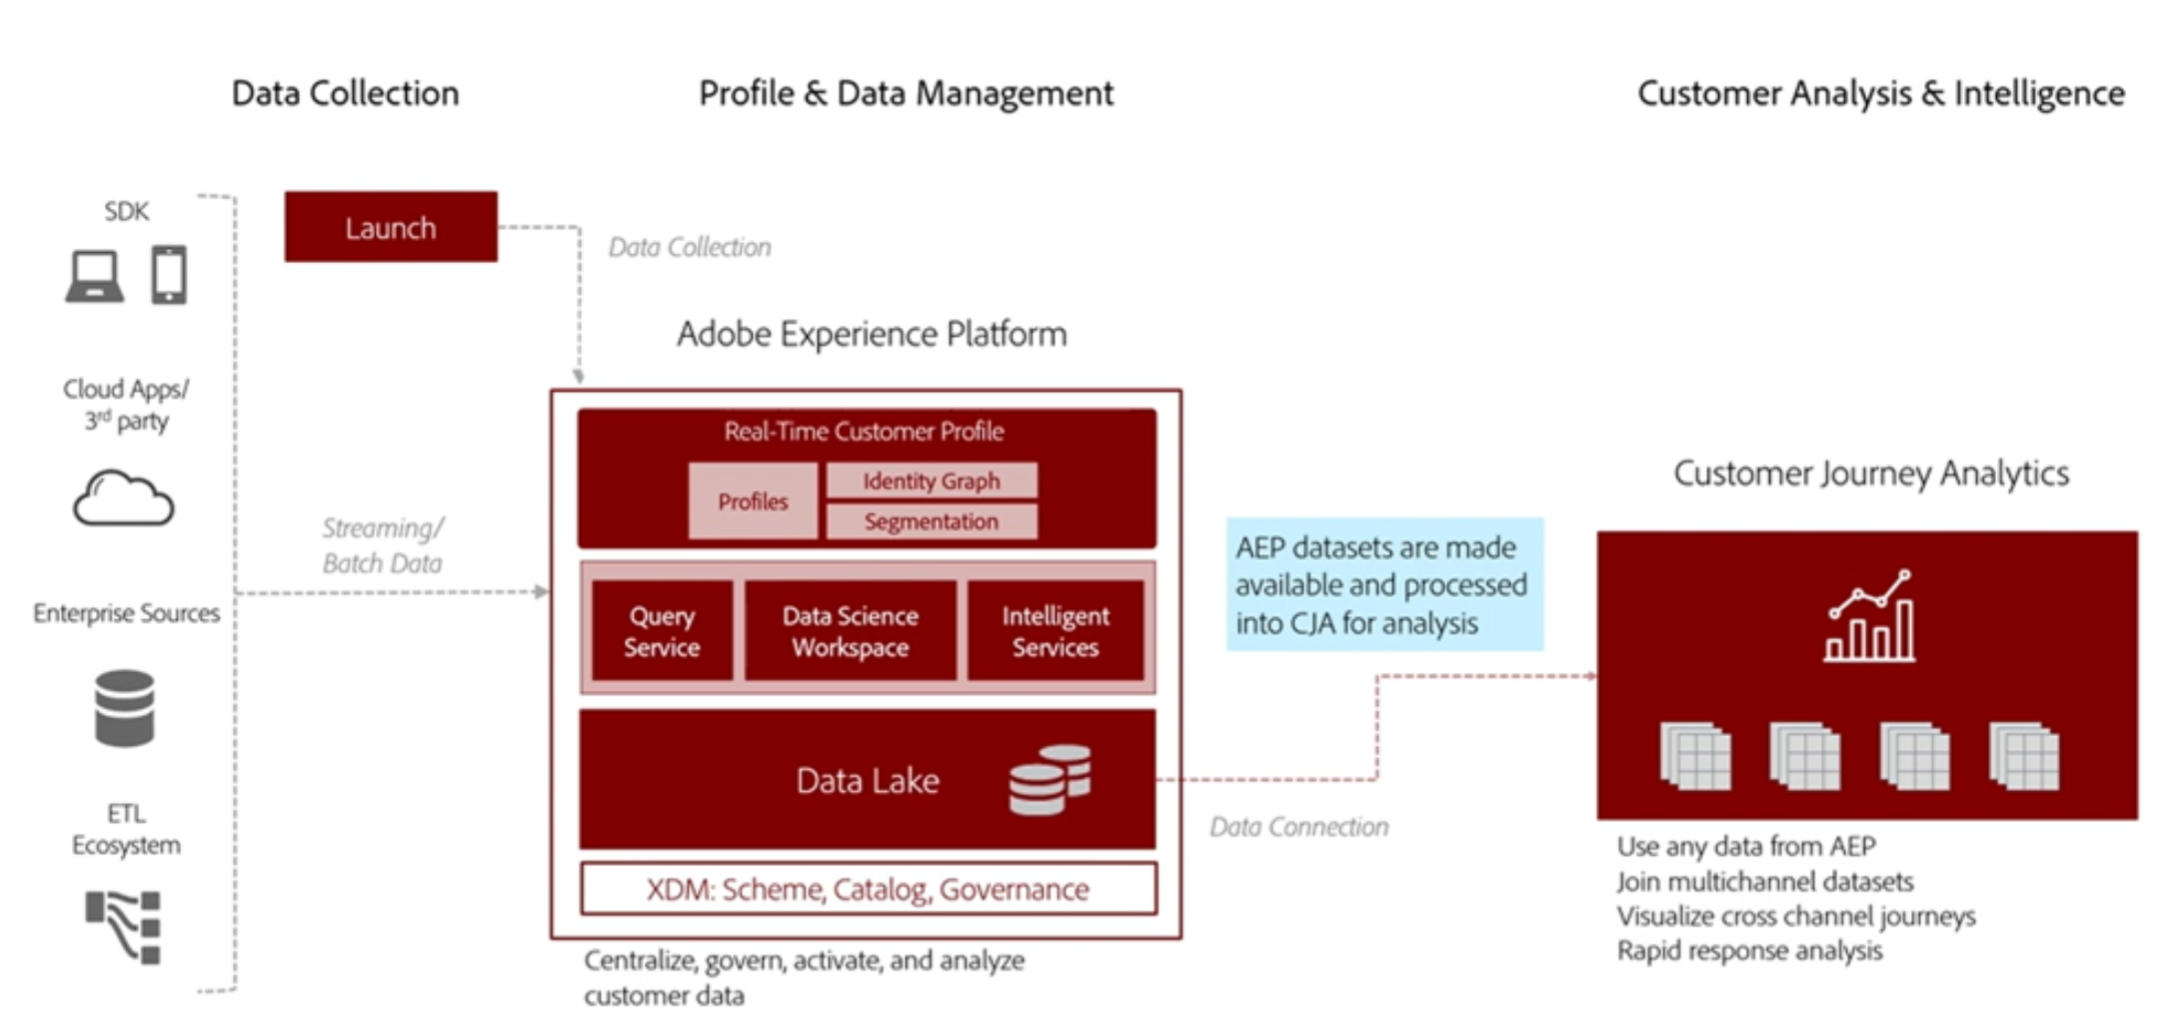
Adobe Customer Journey Analytics | Architecture
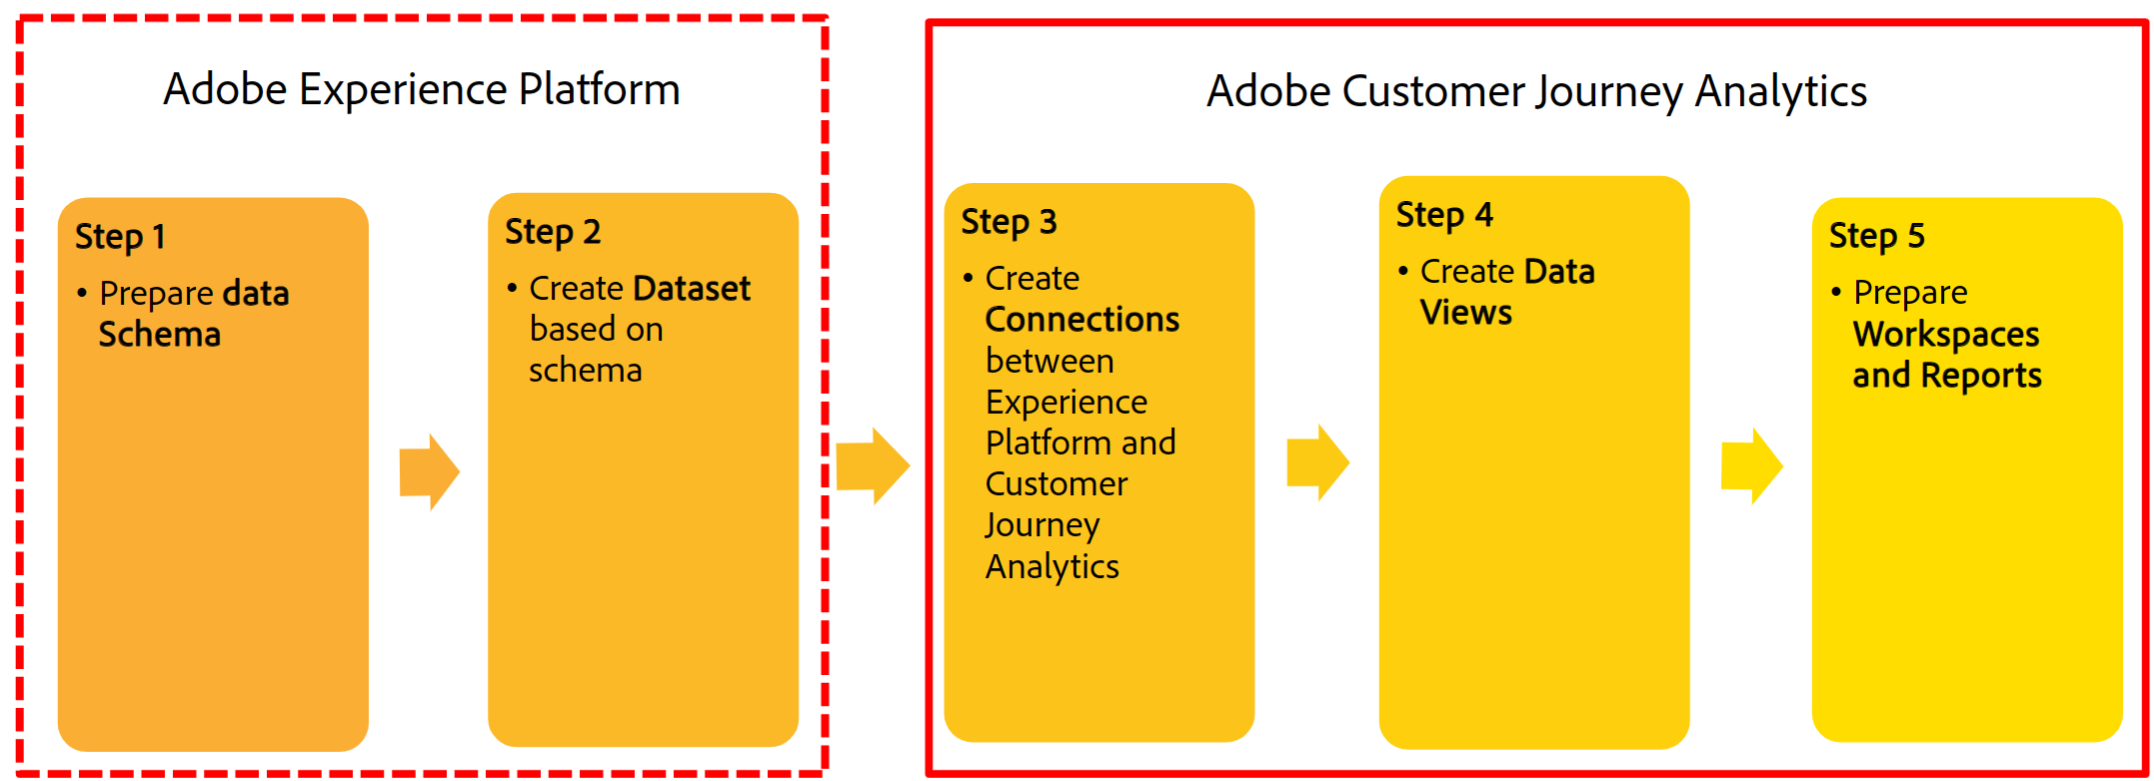
Adobe Customer Journey Analytics Workflow
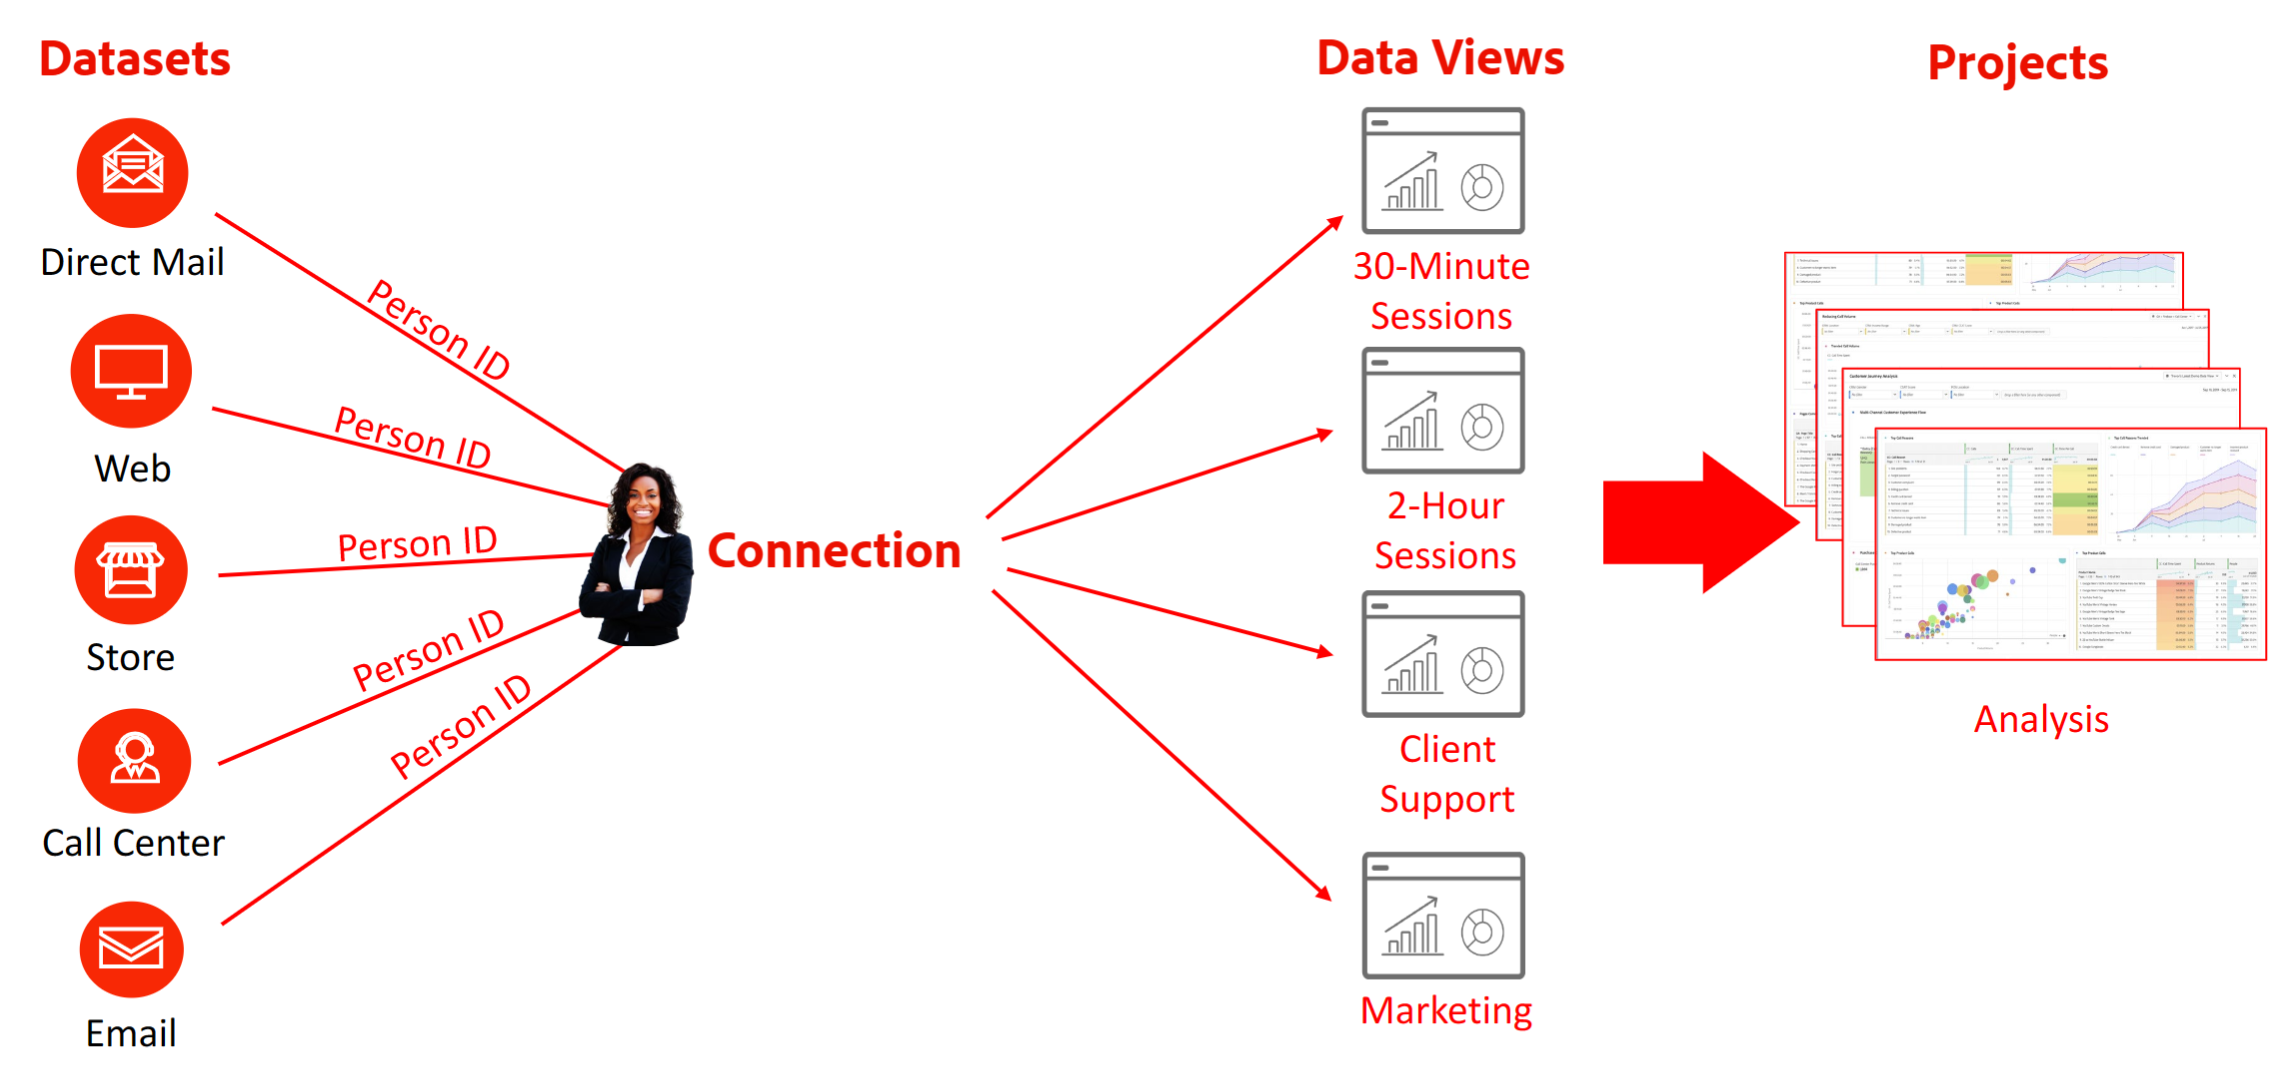
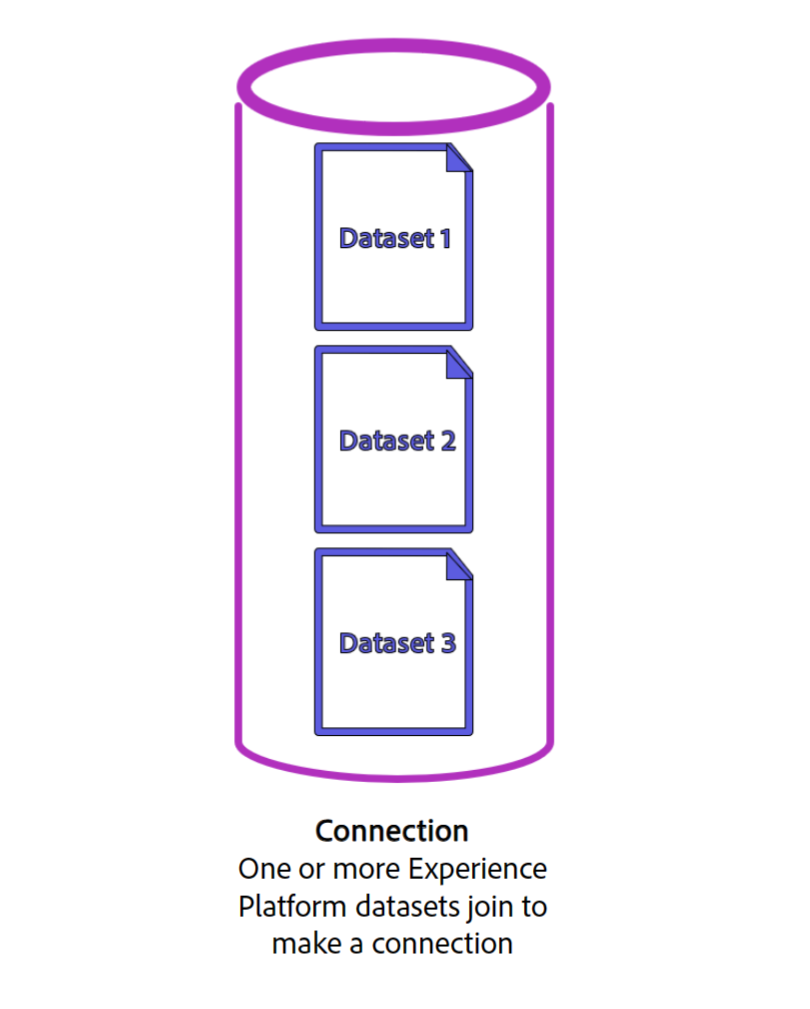
Connections in Adobe Customer Journey Analytics
- Help integrate datasets from AdobeExperience Platform to Workspace.
- Establish a connection between datasets inExperience Platform and Workspace.
Data Views in Adobe Customer Journey Analytics
Enables you to determine how to interpret data from a connection
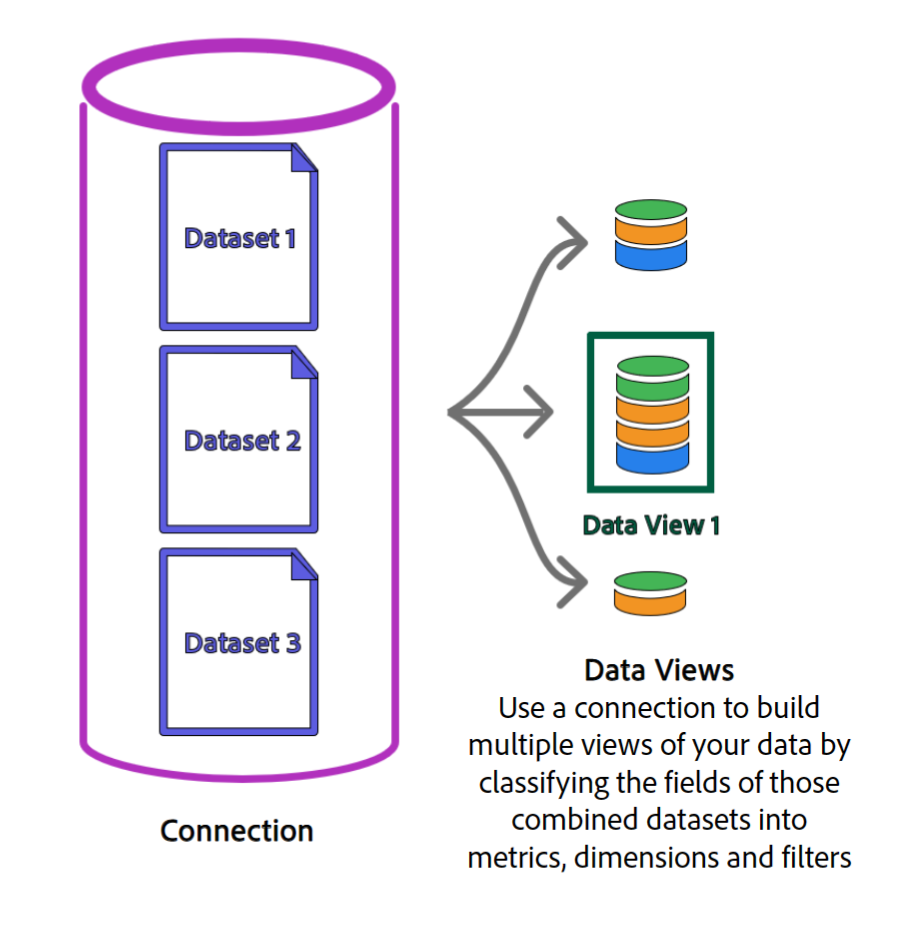
Data Views | Capabilities
- Change a component from a Metric to a Dimension and vice versa.
- Create multiple metrics with different attribution models or with different look back windows.
- Edit the ID of a component
- Specify a friendly name that appears in Analysis Workspace
- Tag a component
- Create a metric or a dimension based on the values in the schema field
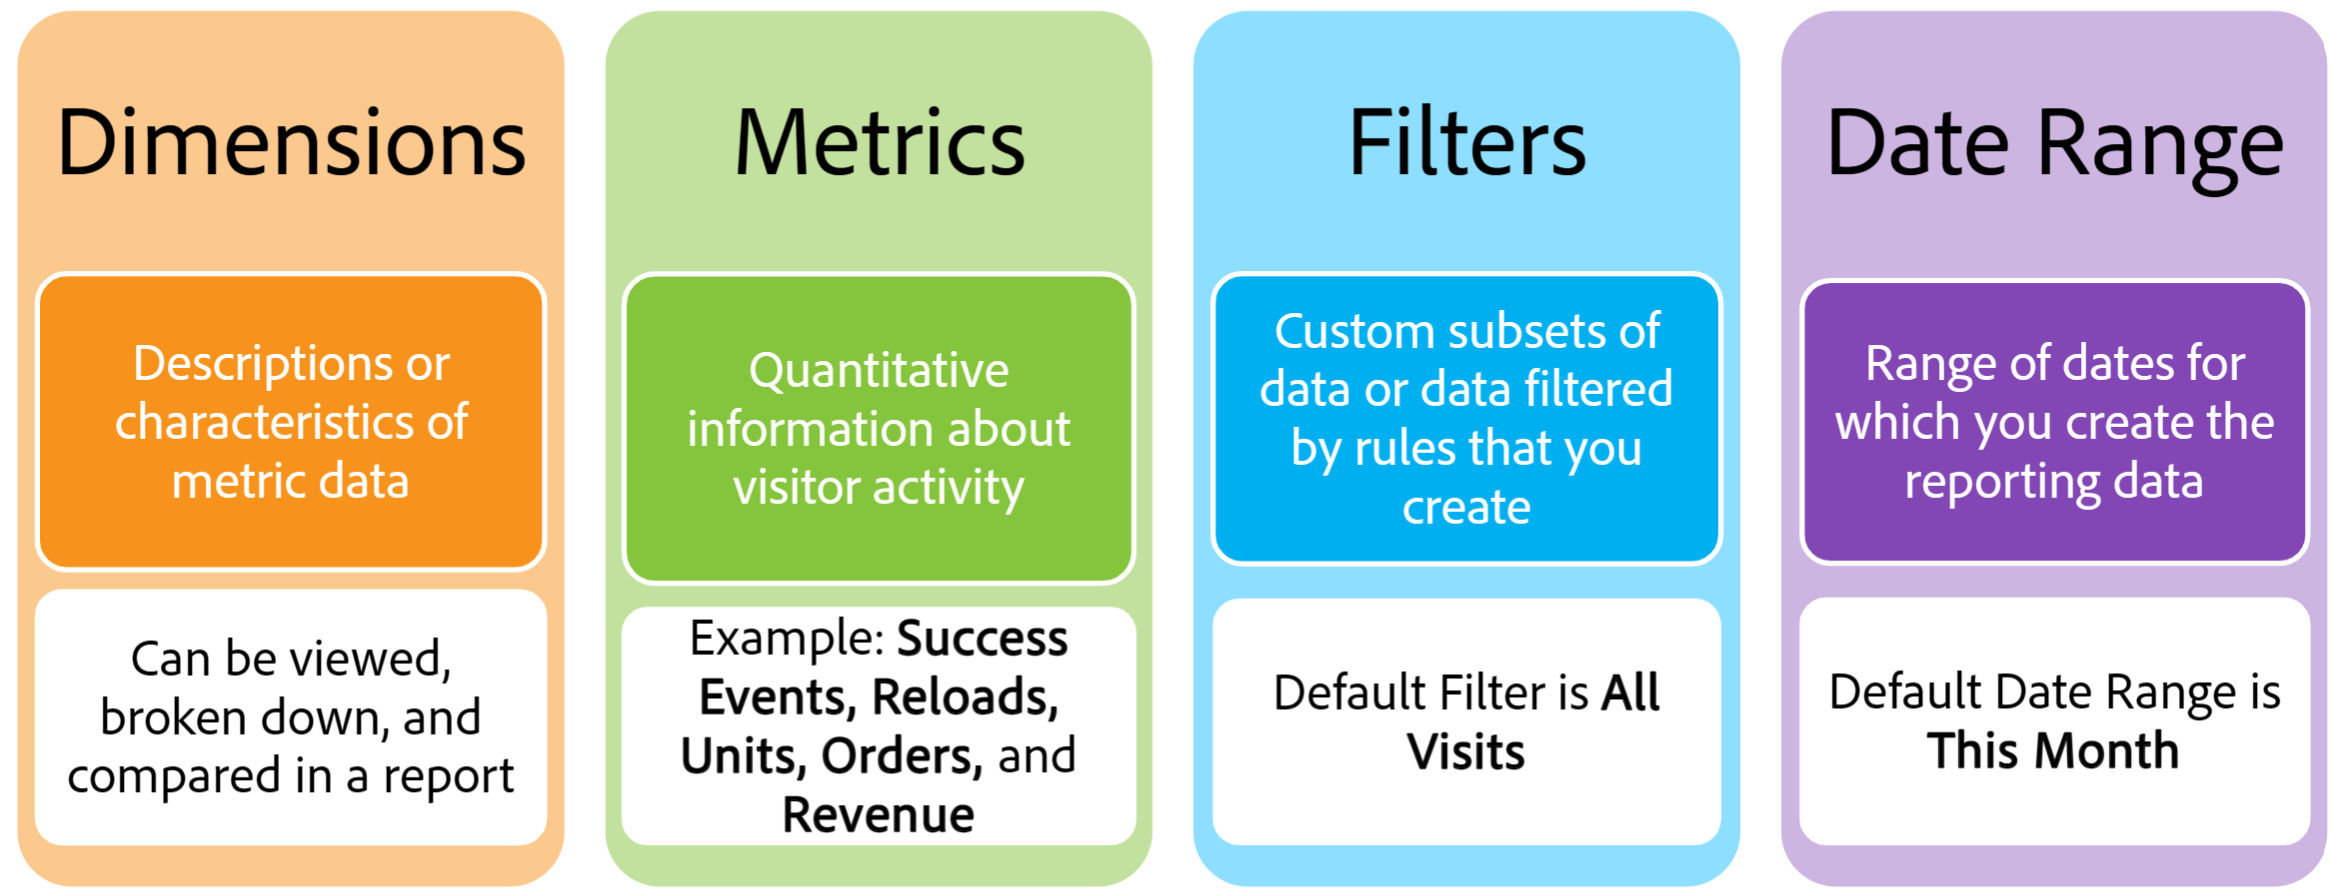
Reporting Components
Components are the building blocks of reports
Filters in Adobe Customer Journey Analytics
Filters help you to:
- Identify subsets of visitors based on characteristics or website interactions.
- Provide codified audience insights that you can build for your specific needs.
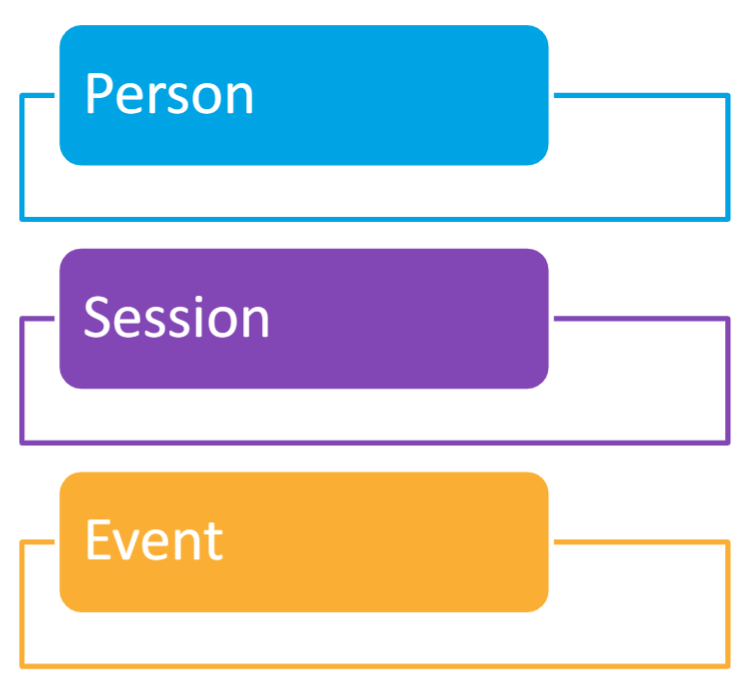
Filter containers
- Based on a Person, Session, and Event level hierarchy using a nested container model.
- The nested containers define person attributes and actions based on rules between the containers and within each container
Calculated Metrics in Adobe Customer Journey Analytics
- Custom metrics that you can create from the existing metrics.
- Offer a highly flexible way of building, managing, and curating metrics.
- Help drill the data to specific requirements
Using Calculated Metrics, you can:
- Create metrics that are derived at report run time, without having to change the implementation.
- Dig deeper into data across the existing metrics.
- Incorporate statistical functions to help you better describe your data
Create Reports on Multi- Channel Sales
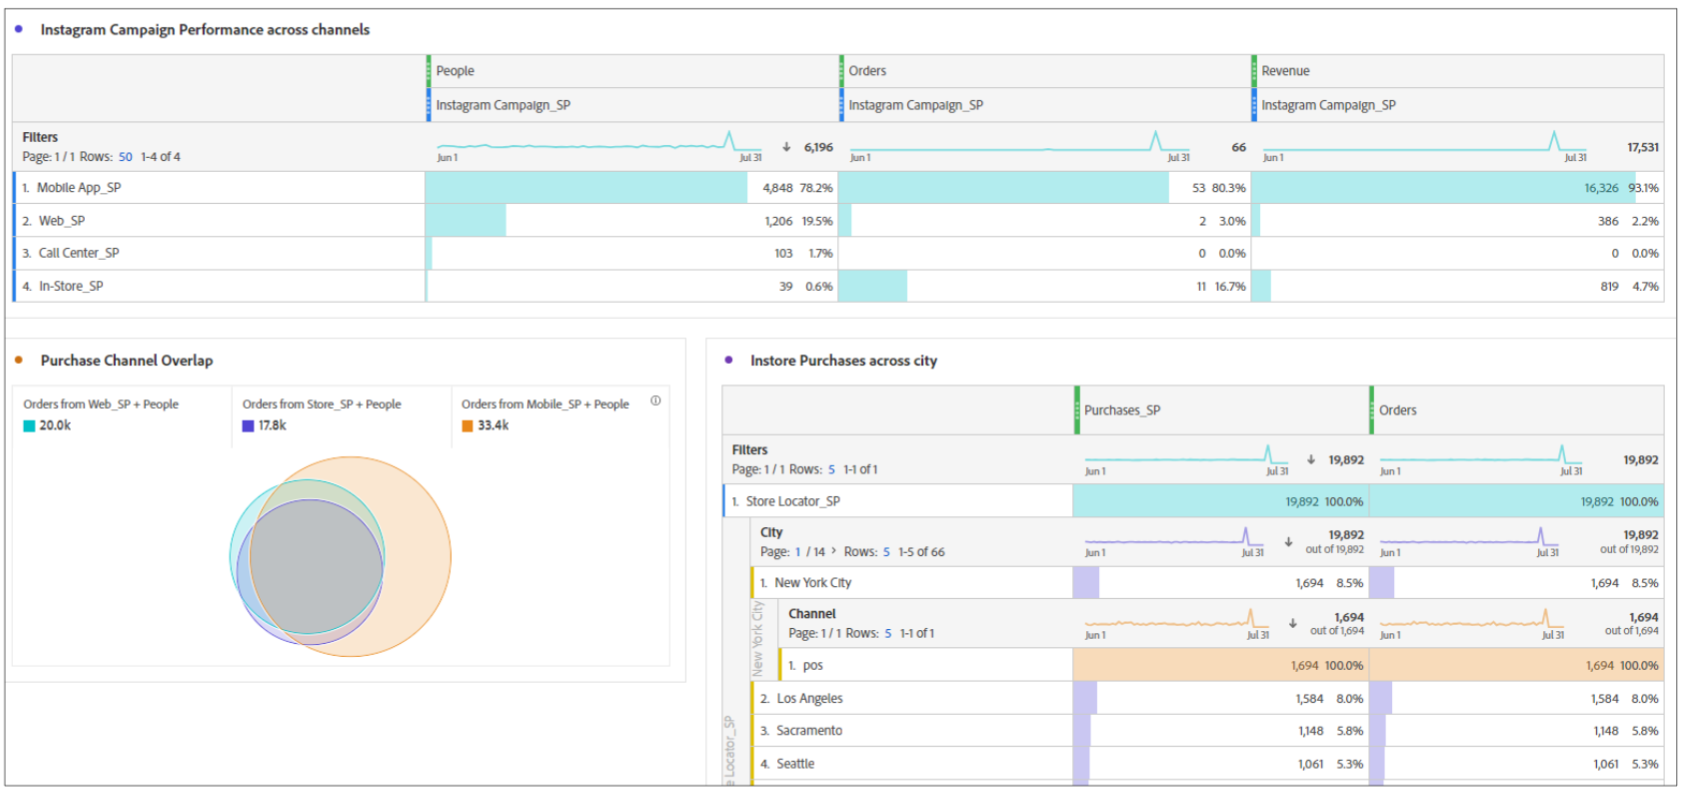
Scenario: You are an analyst at We.Retail which is a retail company.We.Retail needs to study the campaign performance and the product purchase details on different channels for the last two months. You will create campaigns and purchase performance reports to help company visualize the status and analyze the next steps.
Create Mobile Dashboard for Quick Analysis of Cross Channel Data
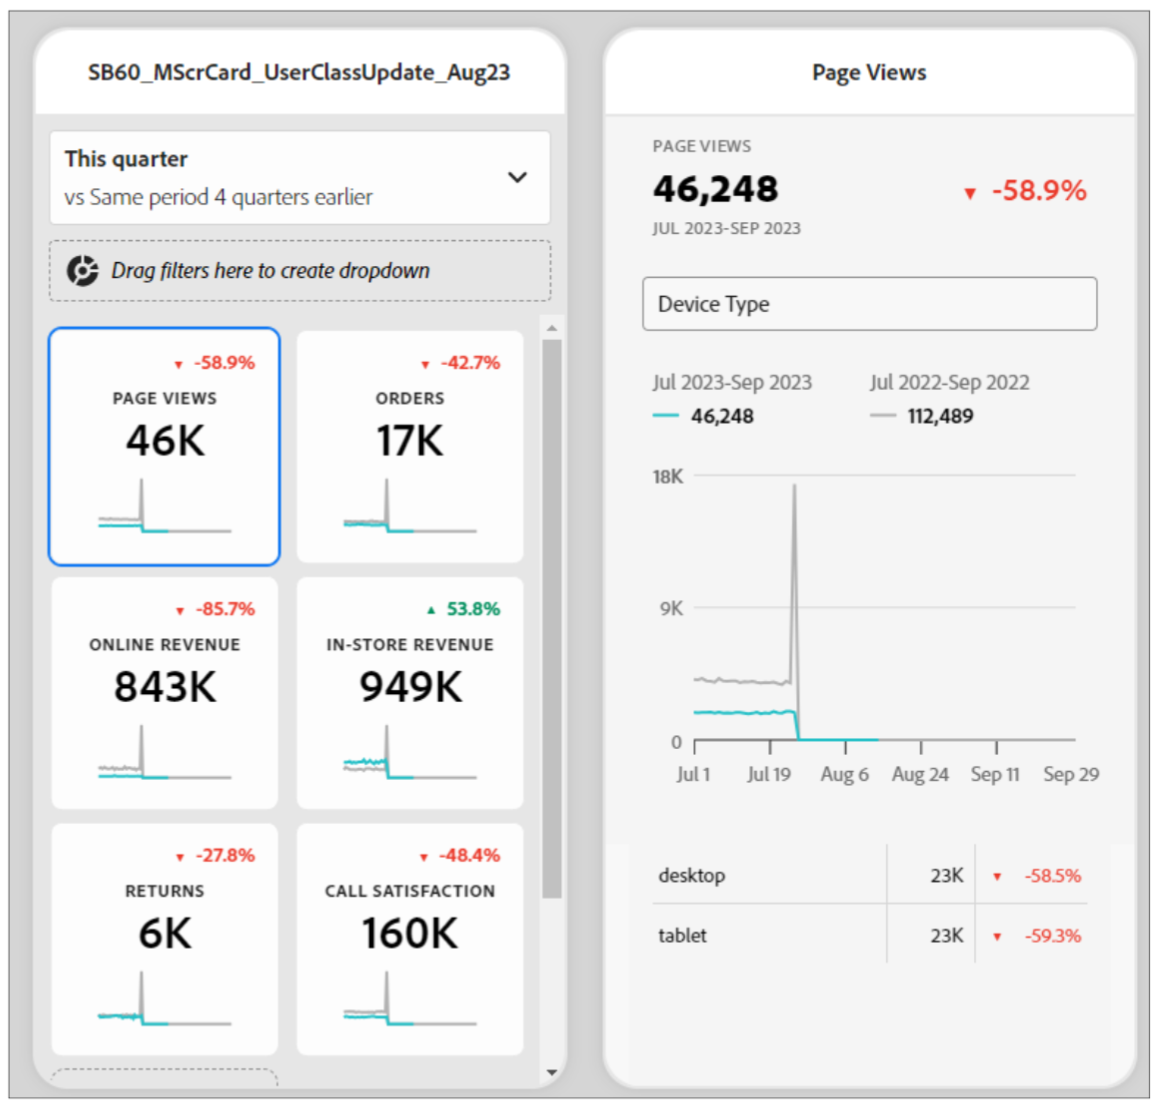
Scenario: You are an analyst atWe.Retail, the retail company and you want to create a mobile dashboard that helps you quickly analyze data per your convenient time and space. To achieve this, you will create a mobile dashboard that includes cross-channel traffic and conversion data.
Create a Project Folder
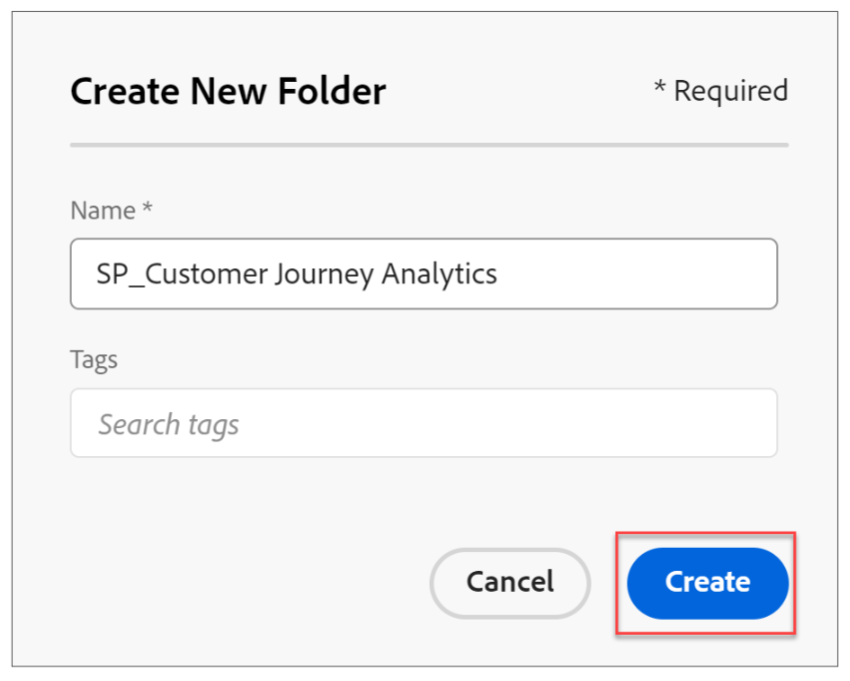
Create a project folder, where you can group all related projects
Create a Project
Create a project in the folder created by you

Use Case
You are an analyst at the retail company LUMA. Your goal for the new fiscal year is to improve online and in-store sales by 10% and enhance customer support to inflate brand loyalty. To achieve this, you need to study the cross-channel traffic and conversion data. You also need to understand the call center data. To generate these data:
First, you create reports on:
 - Total calls and call satisfaction across channels.
 - Cross channel customer journey.
 - Multi-channel purchase and return funnel.
 - Online purchase and mobile app returns
Second, you dig deeper for targeted data by creating the following comparative analysis reports:
 - Cross channel average order value.
 - Multi-channel conversion rate.
 - Multi-channel daily average visits.
 - Combo charts on mobile app revenue.
 - Multi-touch attribution analysis on campaign channel orders.
Third, you decide to:
 - Create returning people revenue Histogram and publish audience to Adobe Experience Platform.
 - Share the project.
Class Use Case Connection Datasets
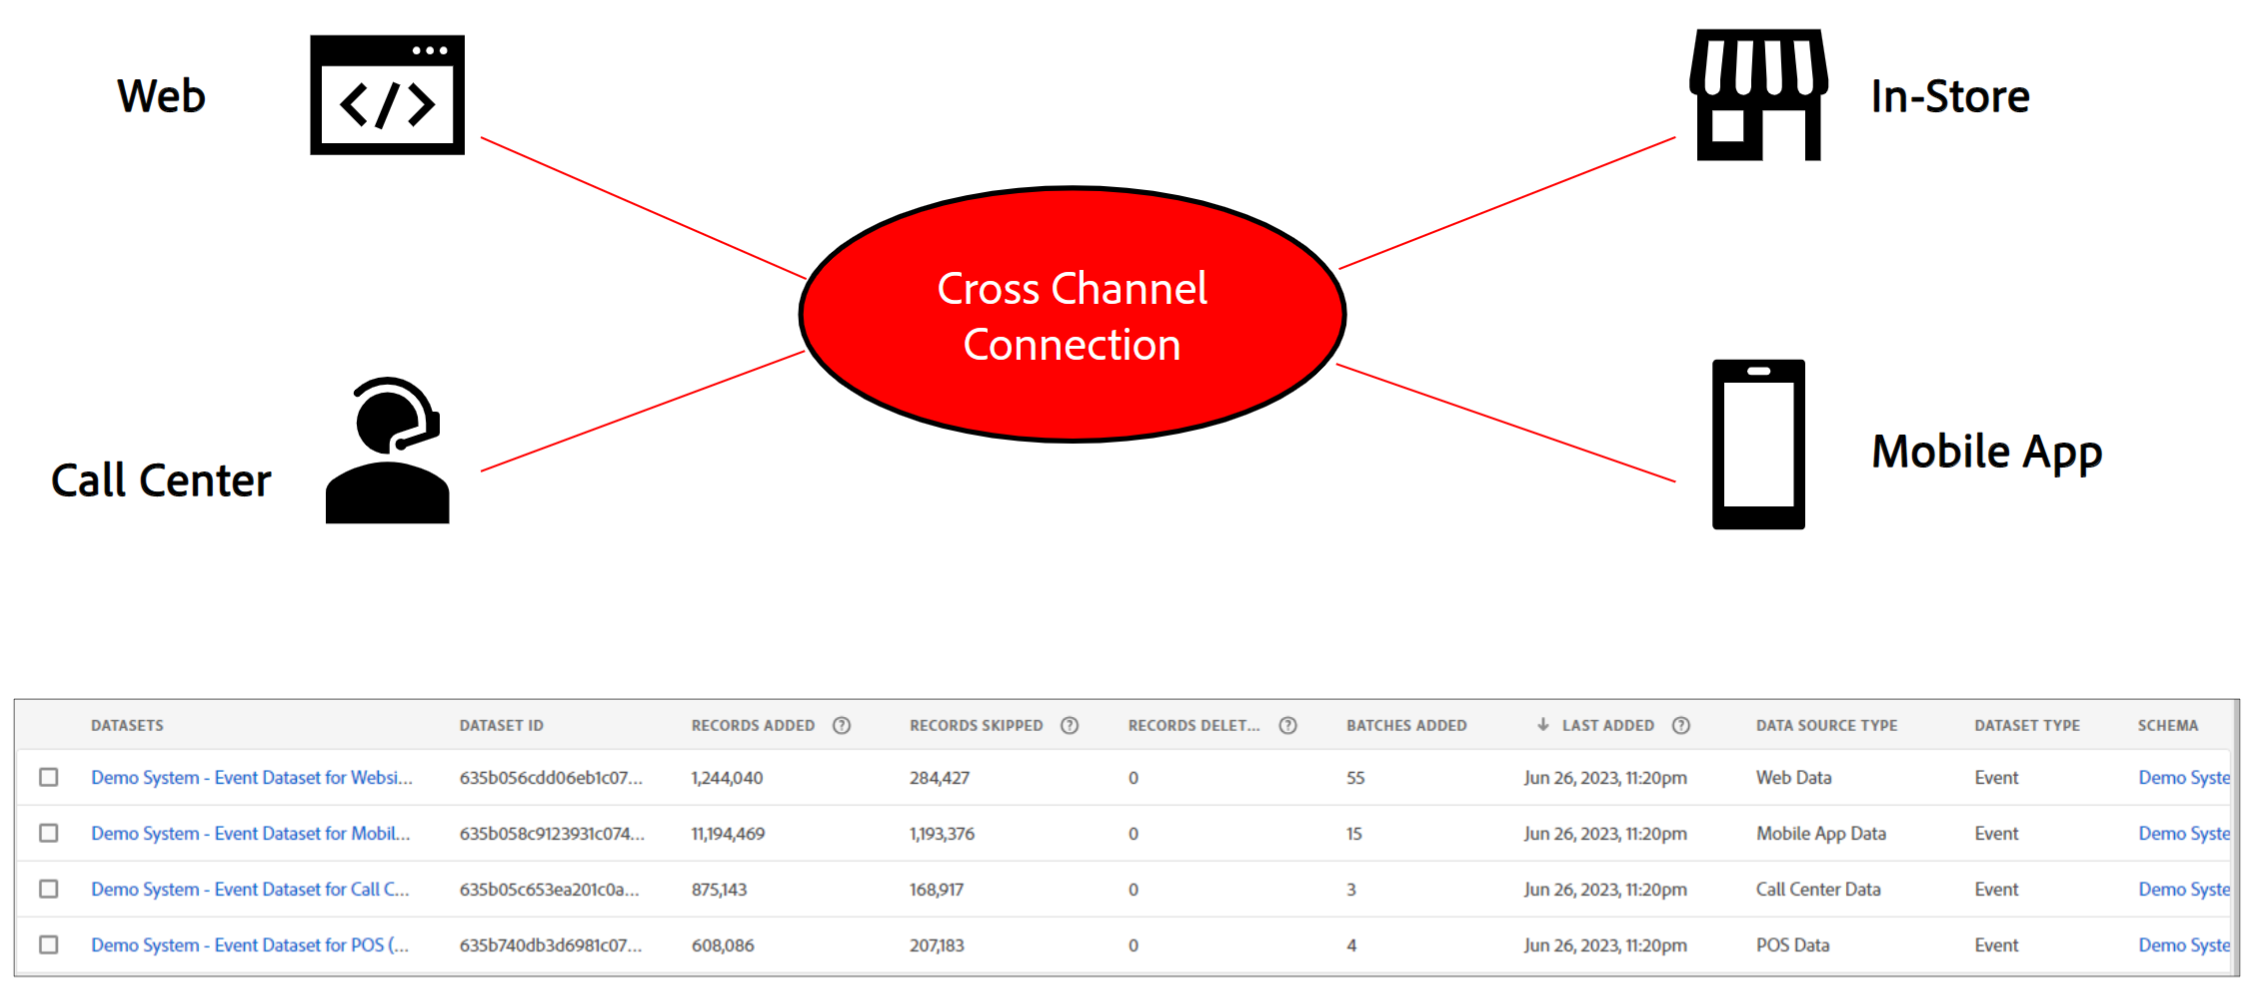
Components Created Through Dataview
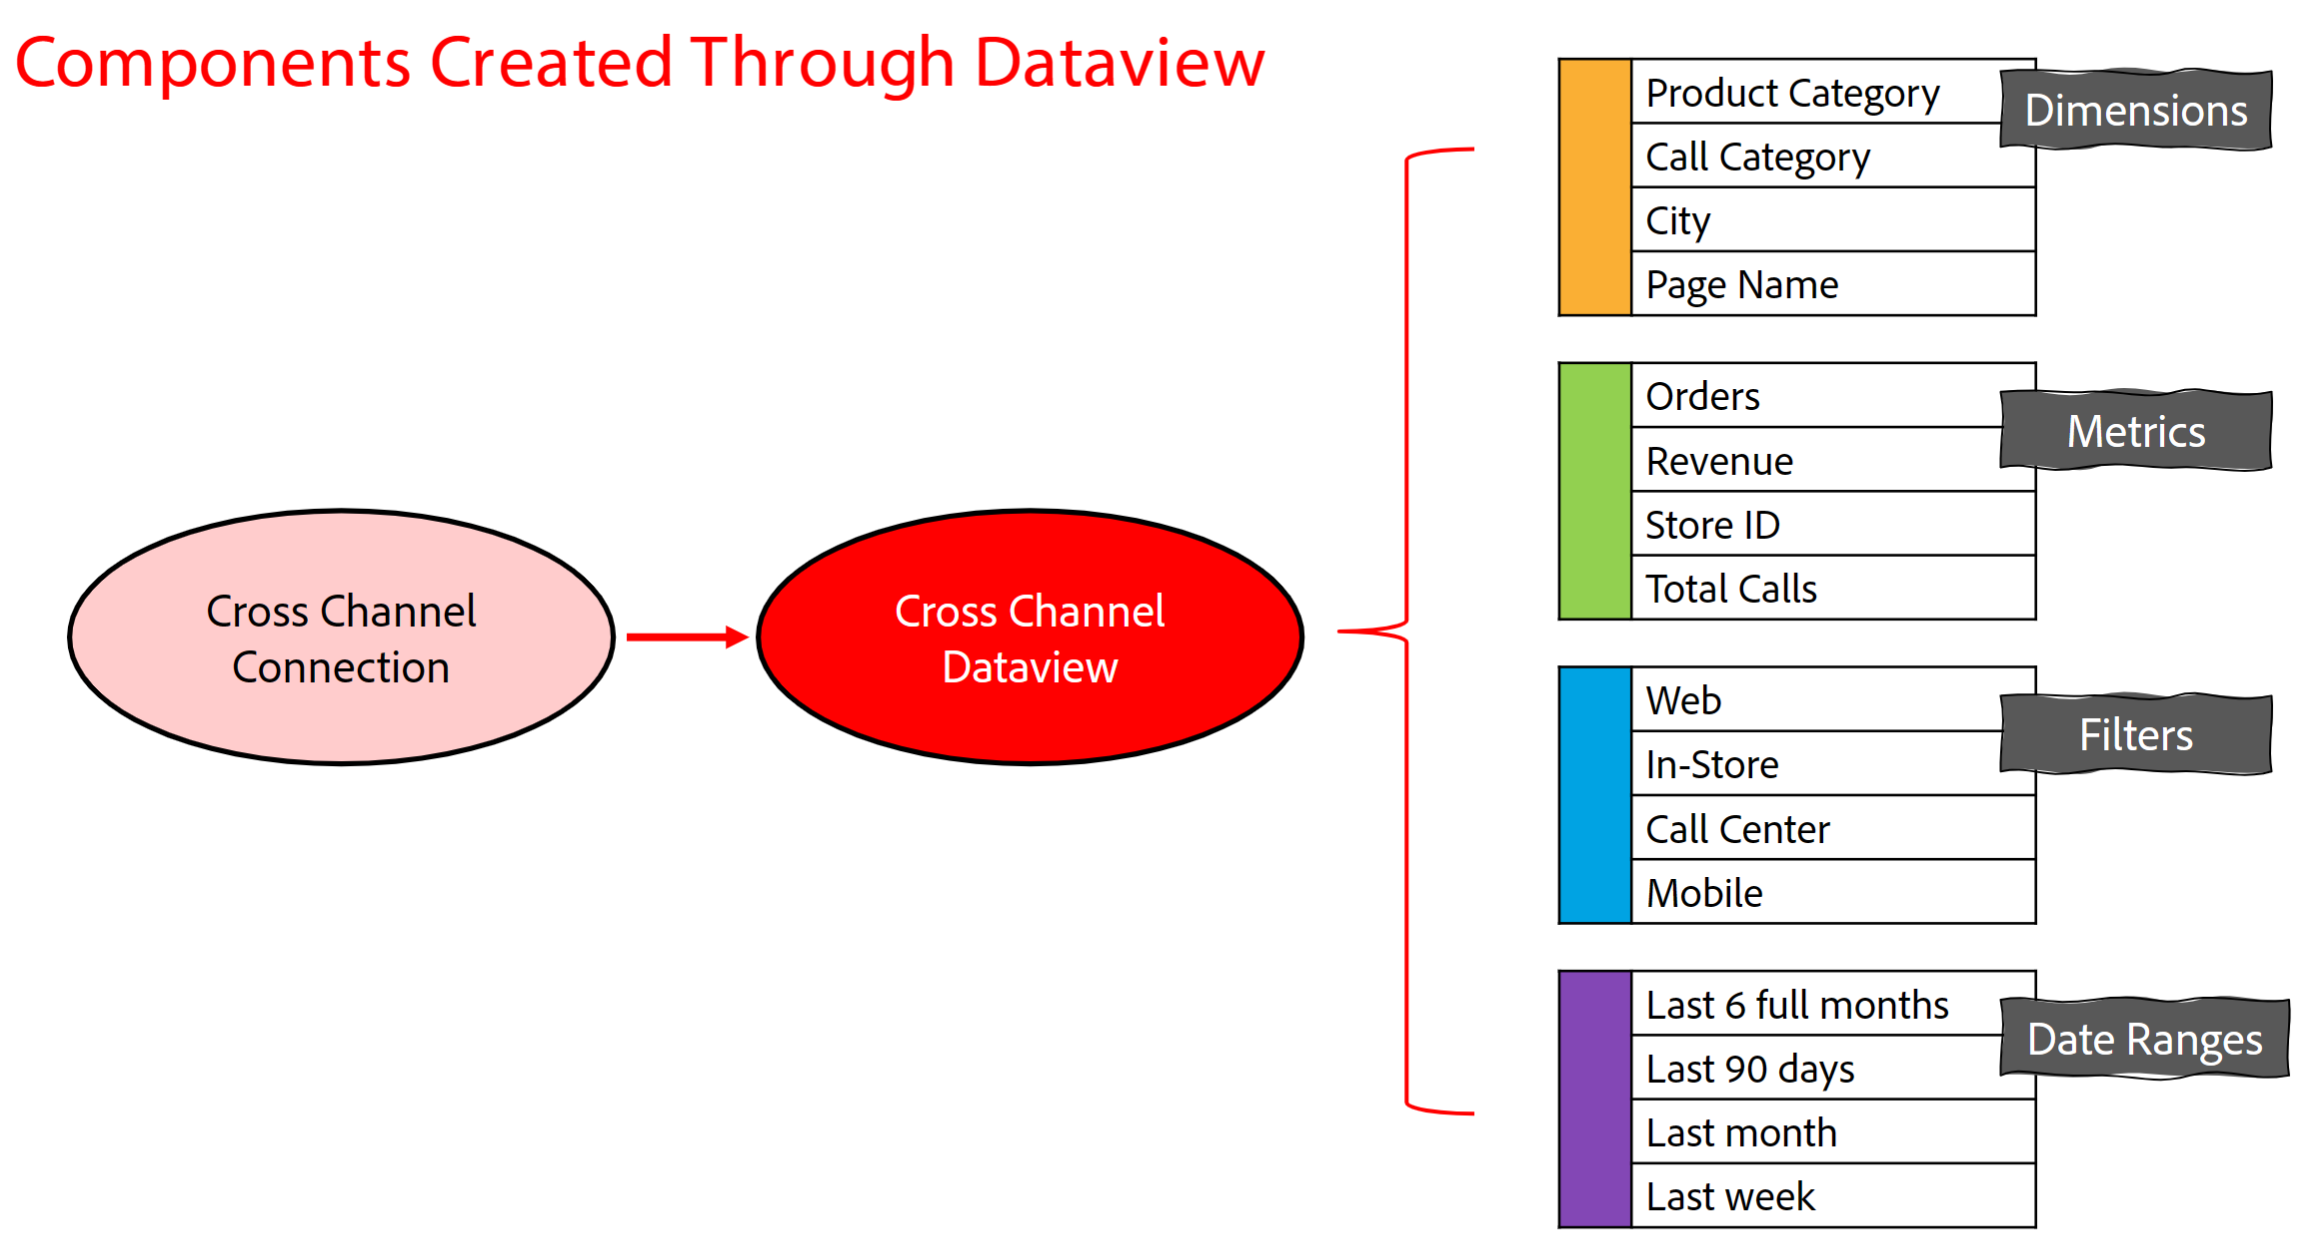
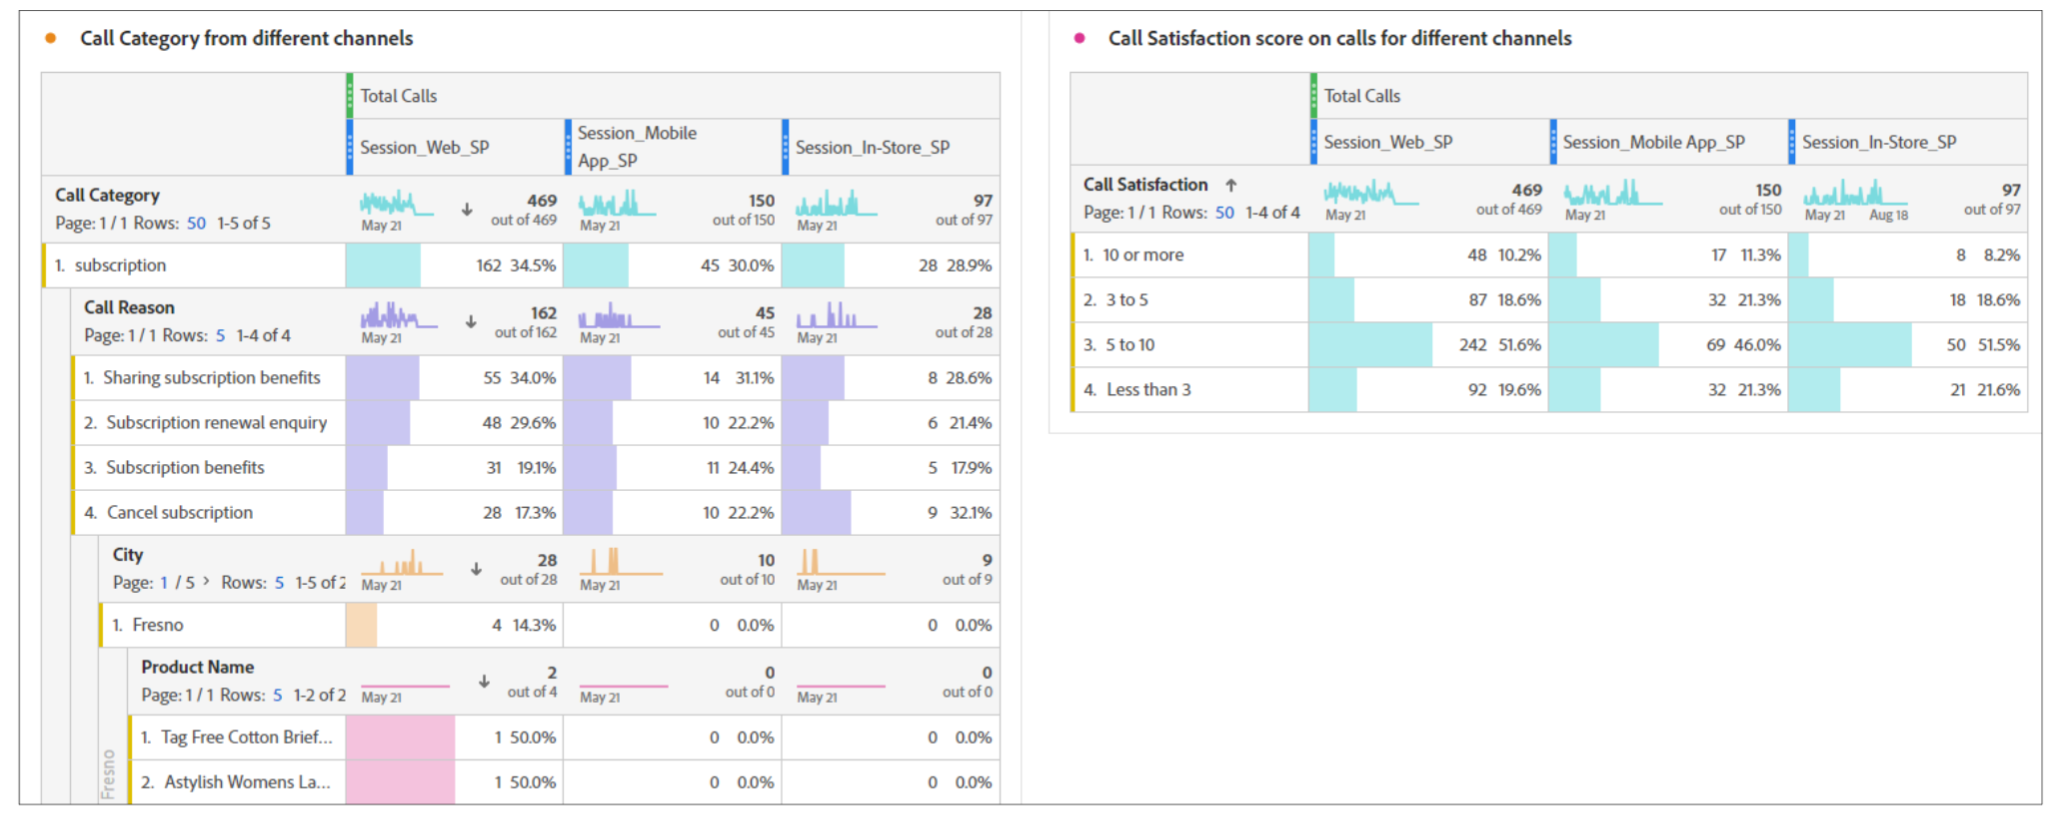
Create Reports on Cross Channel Calls and Call Satisfaction
Scenario: You will conduct data analysis by creating cross channel call center interaction report. You want to understand the various reasons that lead to call center calls across channels and the call satisfaction rate between 1– 10
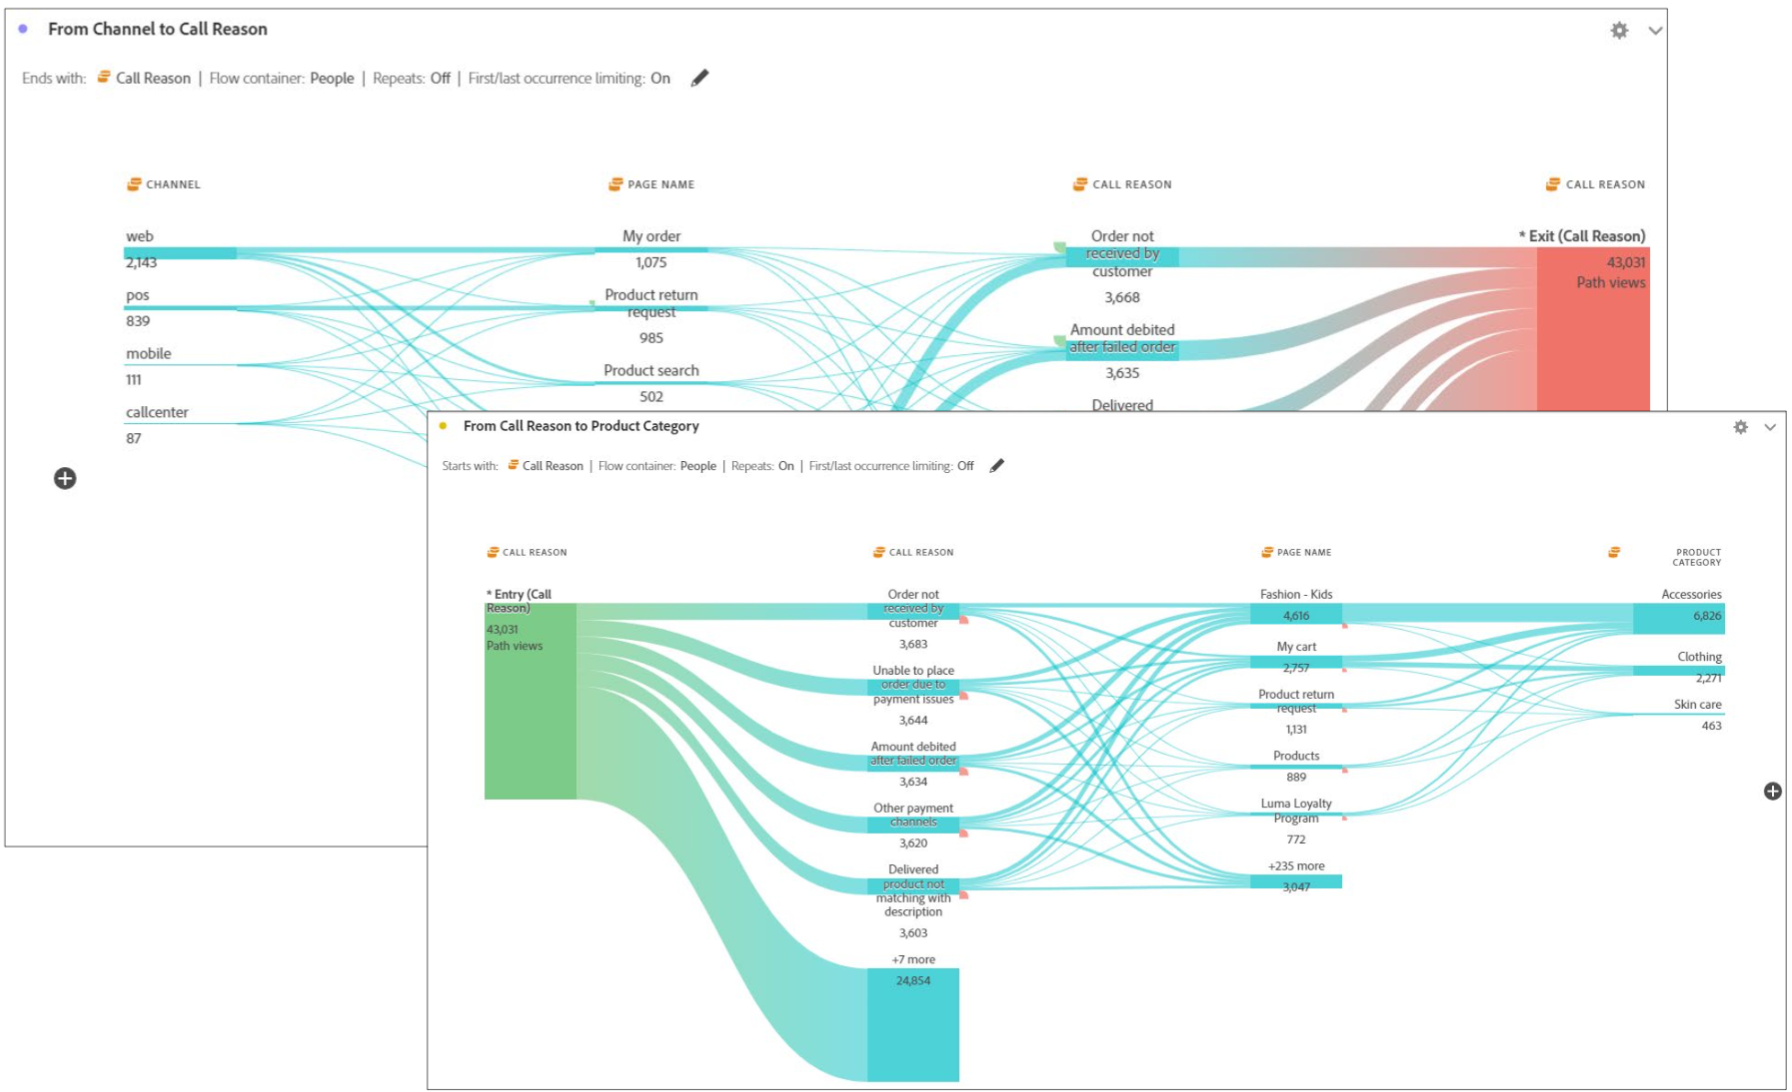
Create a Report on Cross Channel Customer Journey
Scenario: With call reason and call satisfaction data, you now want to understand the customer journey that spanned from different channels to call center and then from call center to web.
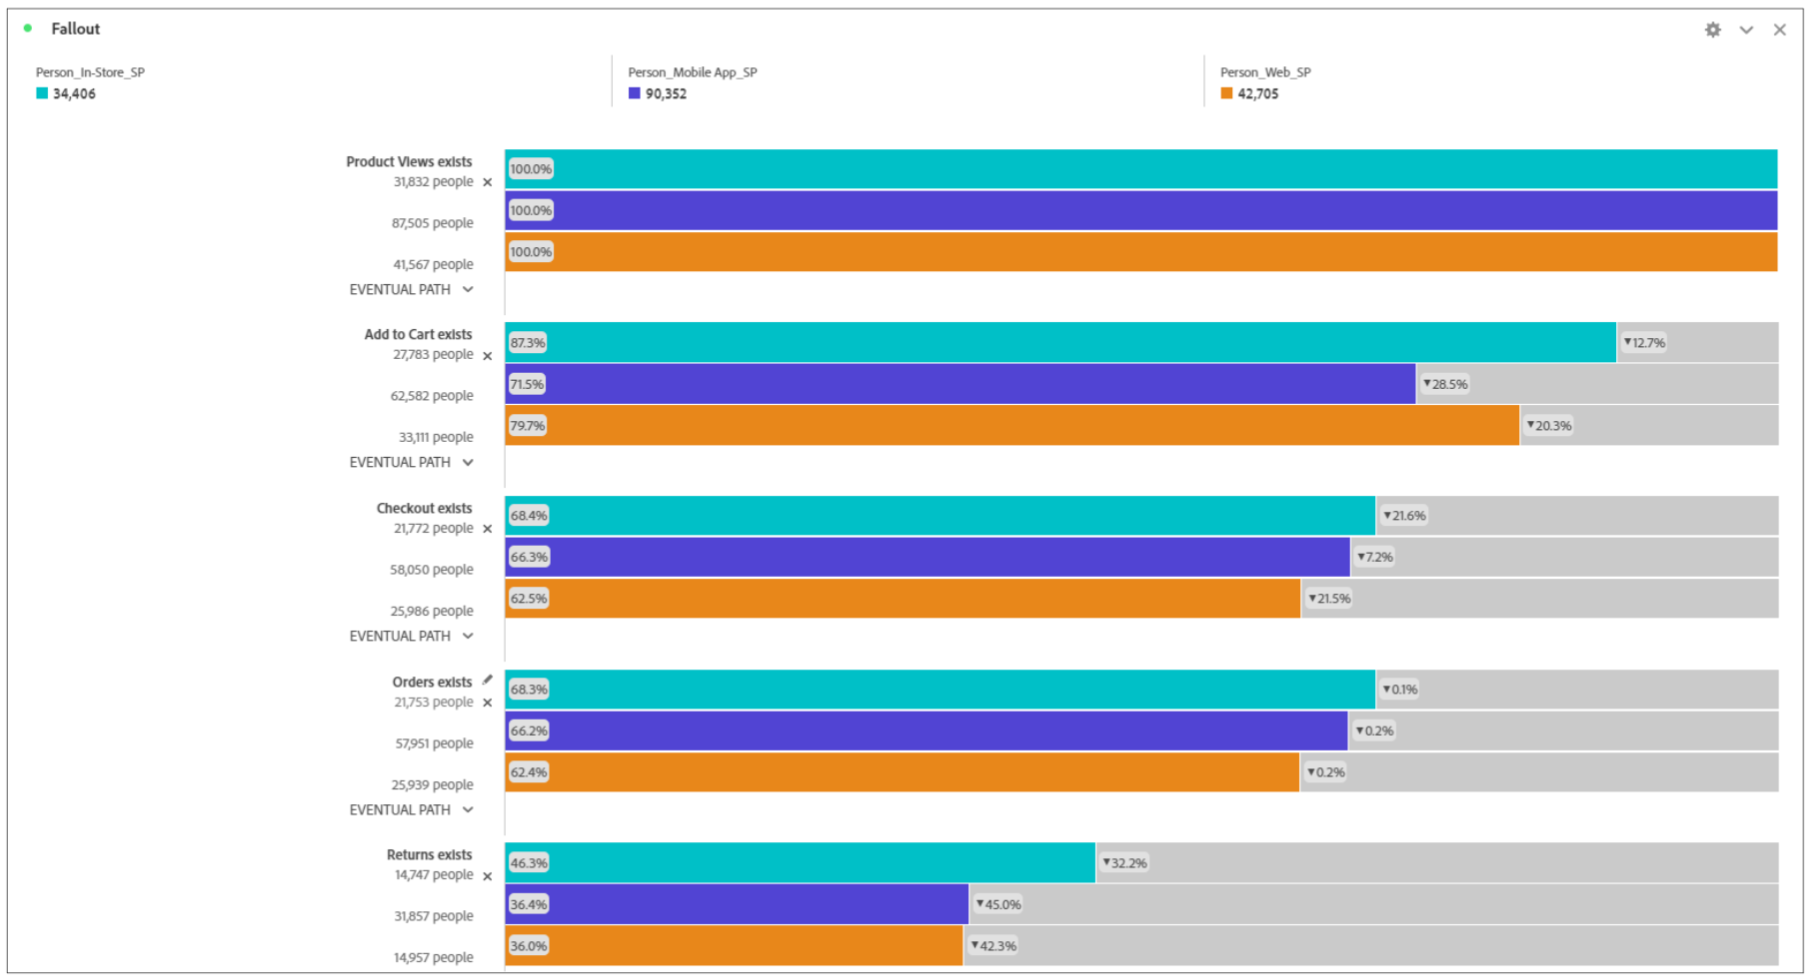
Create a Fallout Report on Multi- Channel Purchase and Returns
Scenario: You now want to understand the fallout rate on purchases and returns across channels.
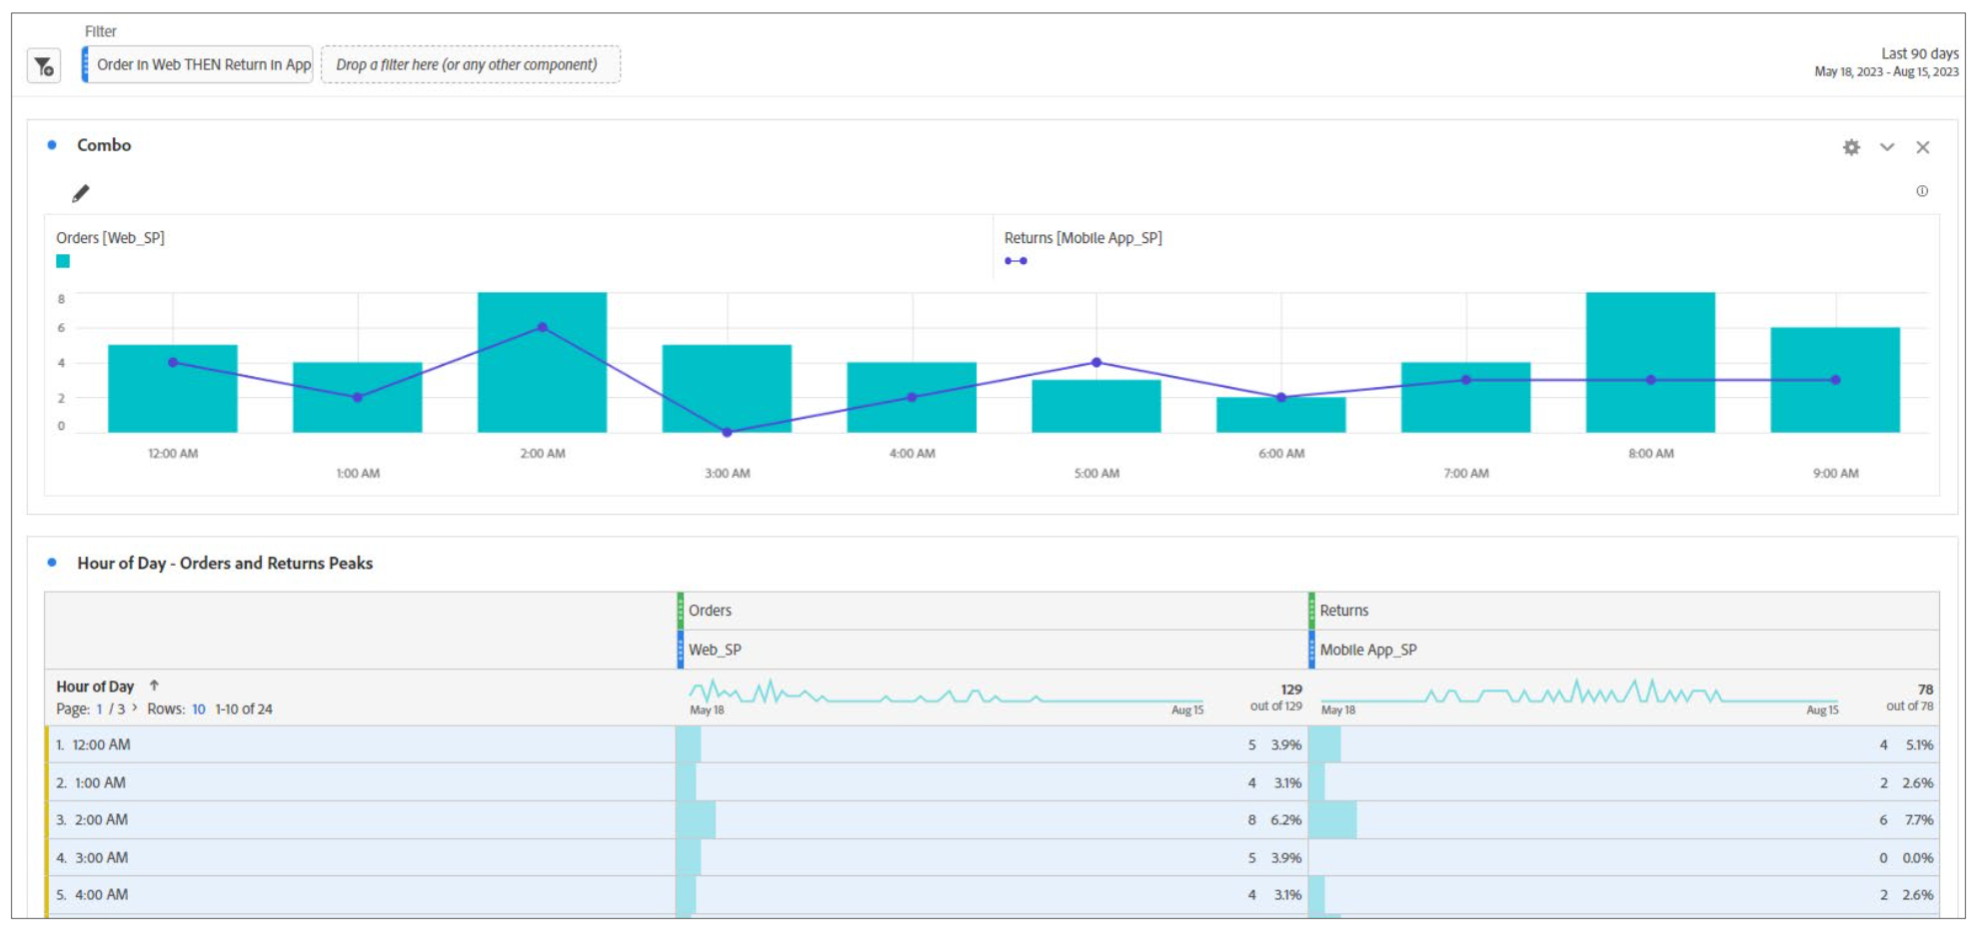
Create a Report on Online Purchase and Mobile App Returns
Scenario: You now want to generate data on the purchases made online and then returned through mobile app in the last 90 days.
Use Case
You are an analyst at the retail company LUMA. Your goal for the new fiscal year is to improve on line and in- store sales by 10% and enhance customer support to inflate brand loyalty. To achieve this, you need to study the cross-channel traffic and conversion data. You also need to understand the call center data. To generate these data:
First, you create reports on:
- Total calls and call satisfaction across channels.
- Cross channel customer journey.
- Multi-channel purchase and return funnel
- Online purchase and mobile app returns
Second, you dig deeper for targeted data by creating the following comparative analysis reports:
- Cross channel average order value.
- Multi-channel conversion rate.
- Multi-channel daily average visits
- Combo charts on mobile app revenue
- Multi-touch attribution analysis on campaign channel orders
Third, you decide to:
- Create returning people revenue Histogram and publish audience to Adobe Experience Platform.
- Share the project.
Create a Report on Cross Channel Average Order Value
Scenario: You want to dig deeper and create comparative analysis reports. You will start by creating cross channel average order value report.

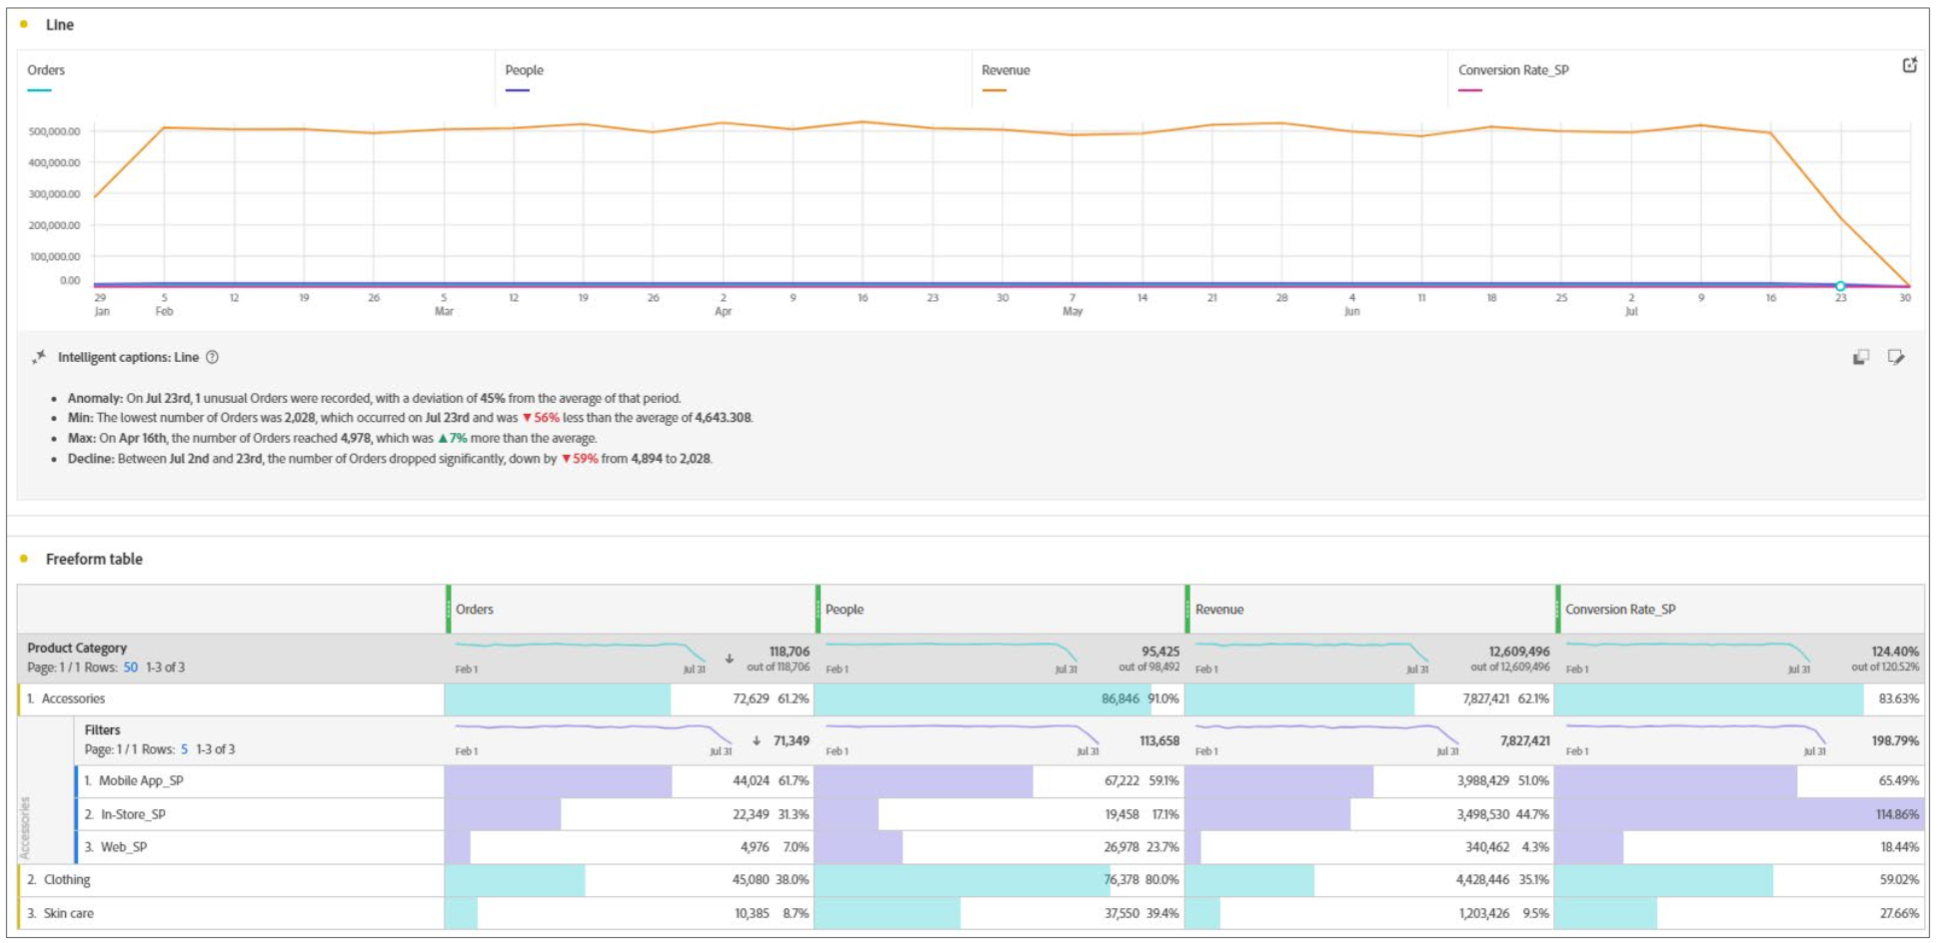
Create a Report on Multi- Channel Conversion Rate
Scenario: You now want to create a conversion rate report to identify the conversion rate across channels. You will generate these details over a product category.
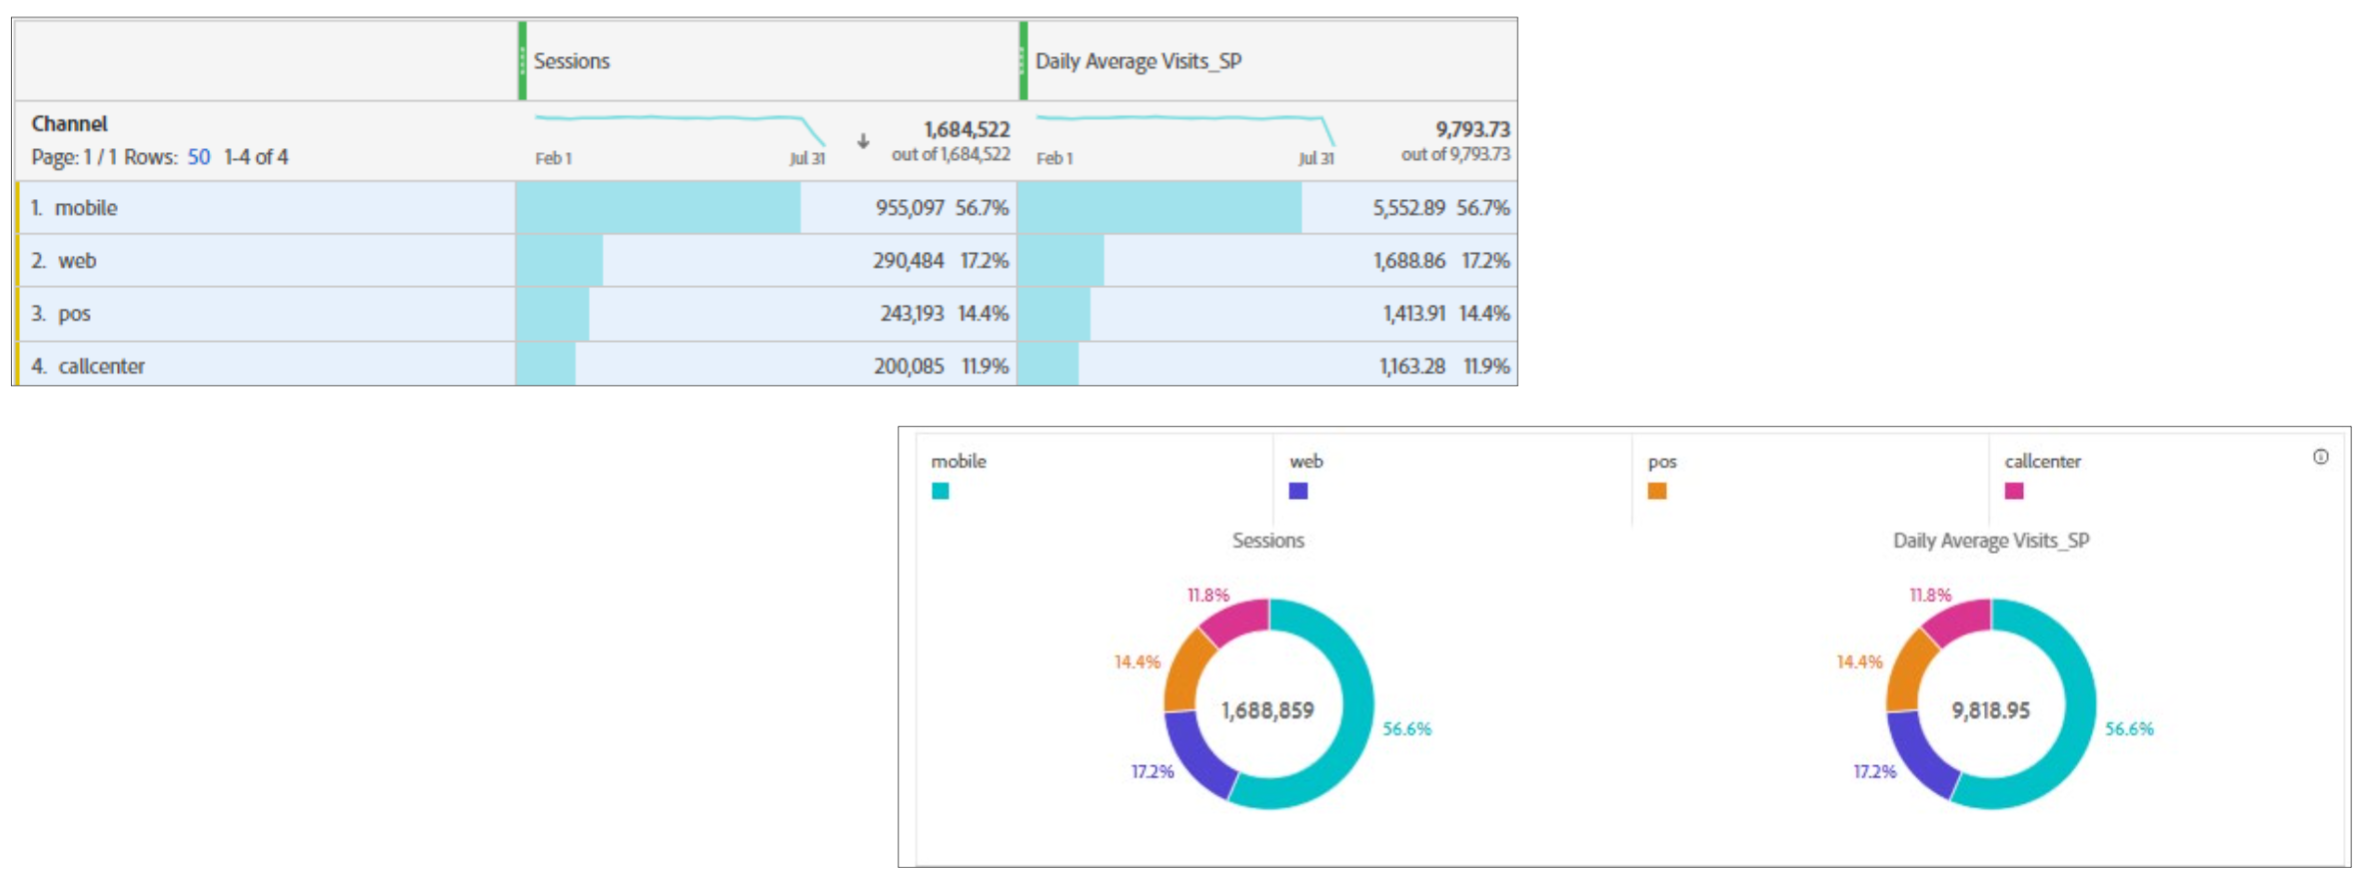
Create a Report on Multi- Channel Daily Average Visits
Scenario: Now that you have identified the conversion rate across channels, you want to capture data on the daily average visits across channels.
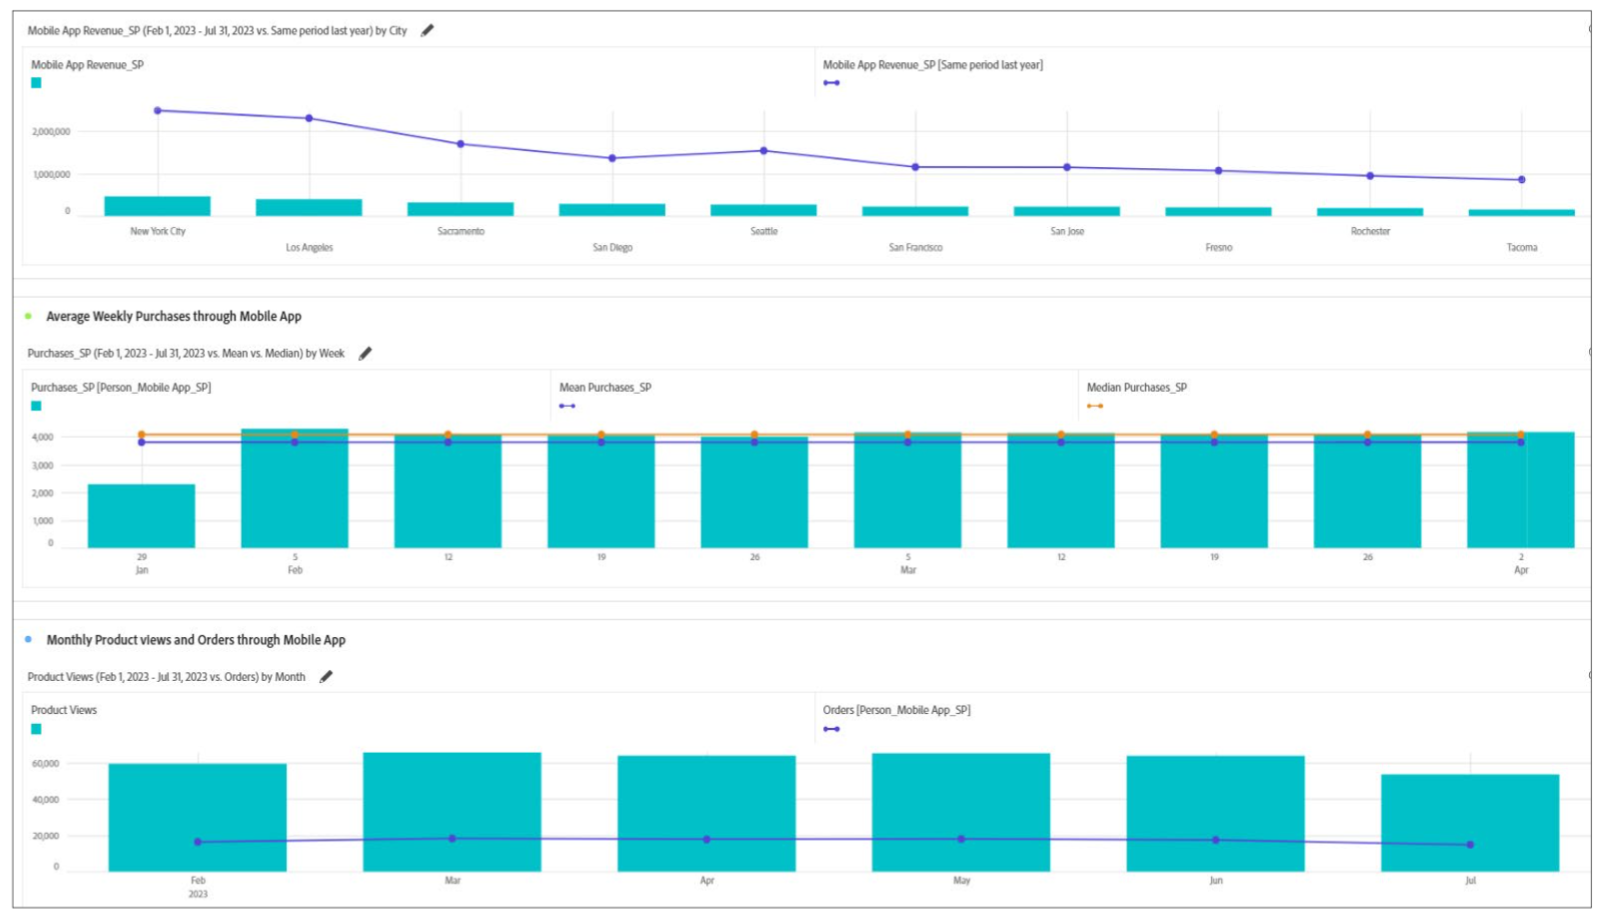
Create Combo Reports to Analyze Mobile App Revenue Details
Scenario: You understand that most visits are coming from the Mobile App channel. You now want to understand the mobile app revenue details. Todo this, you will create combo charts to study Revenue,Average weekly purchases,and Monthly product views and orders all coming throughMobile App.
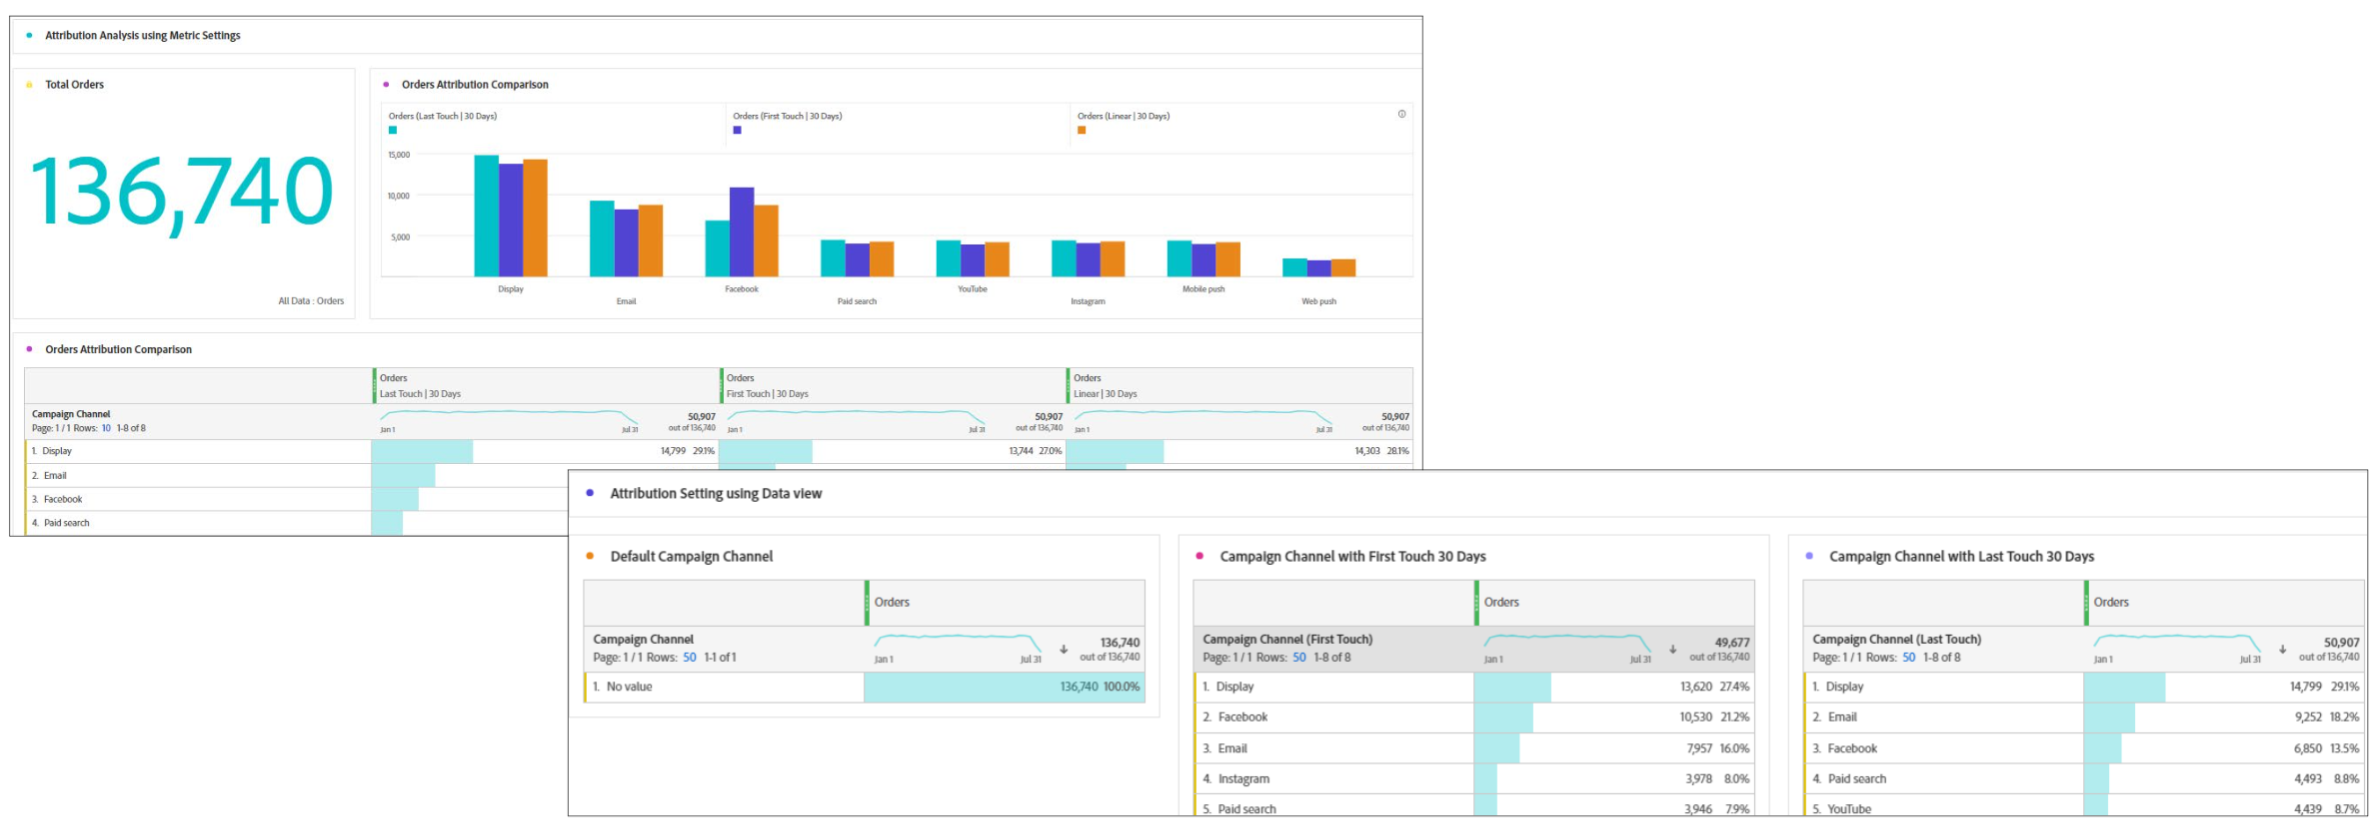
Create a Multi- Touch Attribution Report to Analyze Orders ThroughCampaign Channels
Scenario: You now want to create the attribution data dashboards for cross-over and multi- touch data analysis. You decide to create metric settings and dataview settings attribution analysis dashboard.
Use Case
You are an analyst at the retail company LUMA. Your goal for the new fiscal year is to improve online and in- store sales by 10% and enhance customer support to inflate brand loyalty. To achieve this, you need to study the cross-channel traffic and conversion data. You also need to understand the call center data. To generate these data:
First, you create reports on:
- Total calls and call satisfaction across channels.
- Cross channel customer journey.
- Multi-channel purchase and return funnel.
- Online purchase and mobile app returns.
Second, you dig deeper for targeted data by creating the following comparative analysis reports:
- Cross channel average order value.
- Multi-channel conversion rate.
- Combo charts on mobile app revenue.
- Multi-touch attribution analysis on campaign channel orders.
Third, you decide to:
- Create returning people revenue Histogram and publish audience to Adobe Experience Platform.
- Share the project.
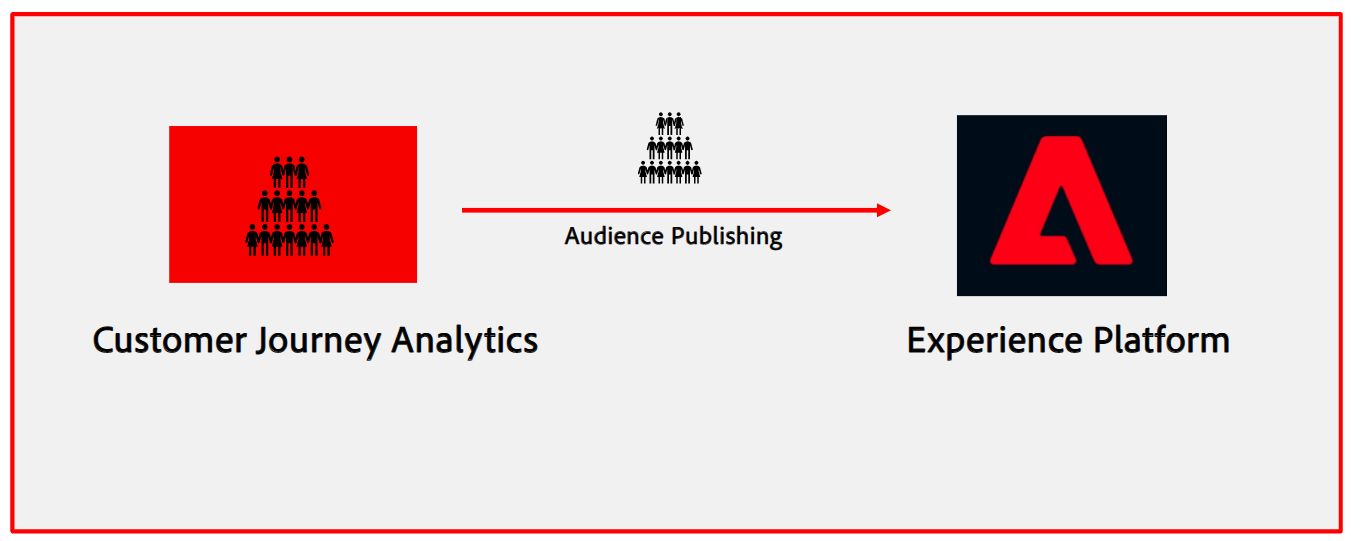
Audience Publishing in Adobe Customer Journey Analytics
Project Sharing
- Share the project with other Analysis Workspace users in the organization.
- Any curation applied is reflected when recipients open the project.
Project Roles:
- Edit – Can edit and save changes to the project.
- Duplicate – Can copy the project but cannot edit.
- View – Can only view the project.
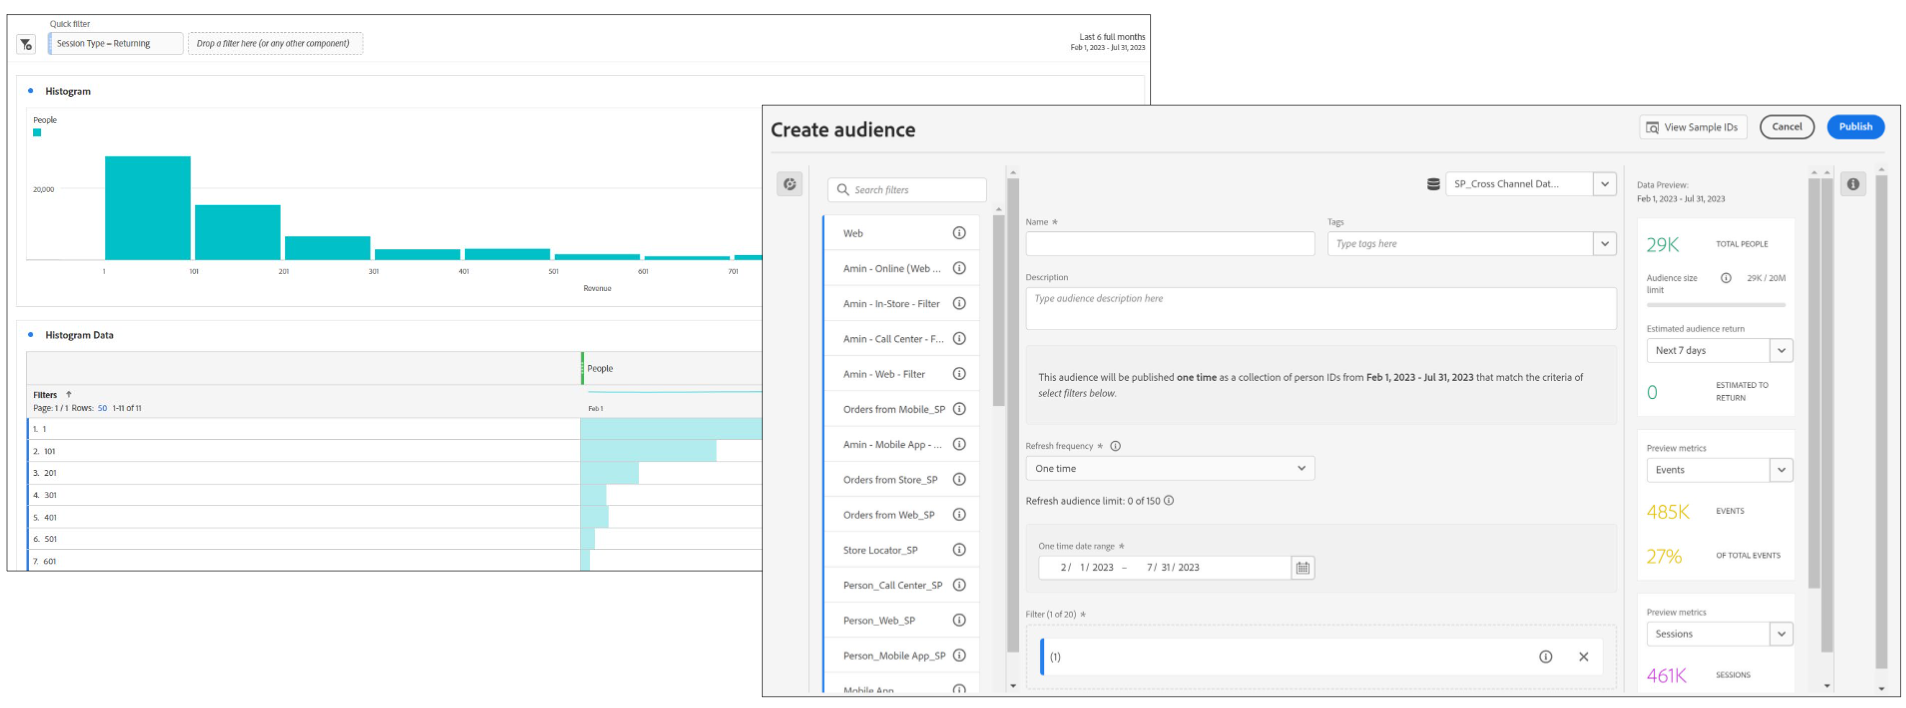
Create a Histogram for Returning People Revenue and Share Audience to Experience Platform
Scenario: You will create a report on the returning people revenue generation. You will also publish the audiences who made a purchase of maximum $100 to Adobe Experience Platform.
Share the Project
Scenario: You have now completed creating the project that includes your cross-channel and multi-touch analytical data. You now want to share the project.
There are two options to share the project:
- Share with Workspace users
- Share with anyone
Use Case
You are an analyst at the retail company LUMA. Your goal for the new fiscal year is to improve on lineand in- store sales by 10% and enhance customer support to inflate brand loyalty. To achieve this, you need to study the cross-channel traffic and conversion data. You also need to understand the call center data. To generate these data:
First, you create reports on:
- Total calls and call satisfaction across channels.
- Cross channel customer journey
- Multi-channel purchase and return funnel
- Online purchase and mobile app returns
Second, you dig deeper for targeted data by creating the following comparative analysis reports:
- Cross channel average order value.
- Multi-channel conversion rate.
- Multi-channel daily average visits.
- Combo charts on mobile app revenue.
- Multi-touch attribution analysis on campaign channel orders.
Third, you decide to:
- Create returning people revenue Histogram and publish audience to Adobe Experience Platform.
- Share the project.
You have completed your journey as an analyst by creating various reports. Based on your analysis and experience, what are the possible suggestions that you can provide to your company to achieve the targeted goals?
Company goals:
- Improve online and in store revenue by 10%.
- Enhance customer support.
