Basic Analysis
Basic analysis enables you to analyze:
- The data sources with maximum number of events, sessions, and people.
- The online versus in- store revenue over  time.
- The audience size by data sources, such as ad impression data, Adobe Analytics data, email data,POS data, call center data, and survey data.
Advanced Analysis:
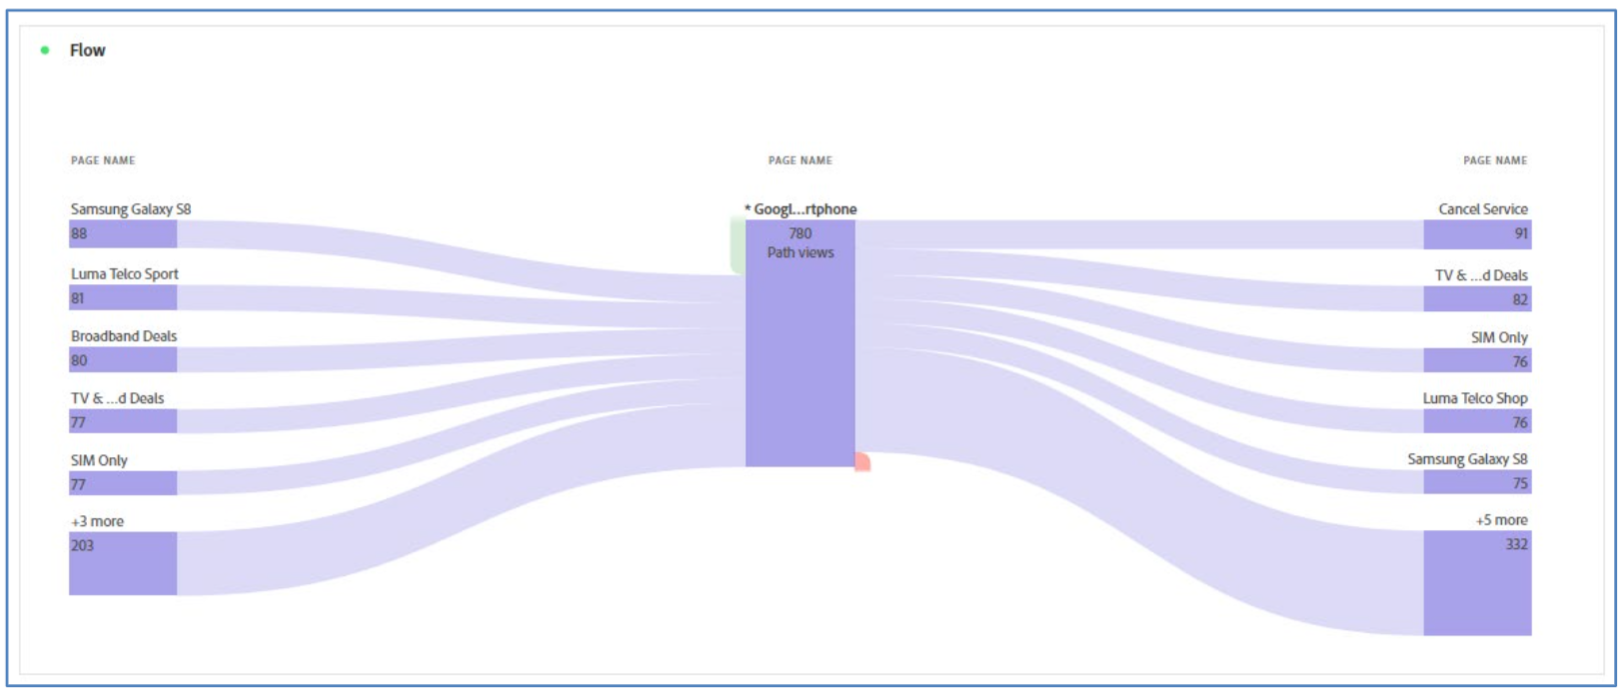
Advanced analysis enables you to leverage the features of Analysis Workspace to perform advanced analysis and create reports, such as Flow diagram, fallout reports, and break down dimensions.
Flow Diagram
Flow diagram enables you to:
- View customer paths through your websites and app.
- Analyze where customers go before and after specified checkpoints, such as entry,  a specific dimension, or exit.
- Create filters by designating a specific point in a chosen path.

Fallout Reports
Fallout reports enable you to:
- Show where visitors left (fell out) and continued through (fell through) a predefined sequence of pages.
- Display conversion and fallout rates between each step or touch point in a sequence.
- Analyze conversion rates through specific processes on your site, such as a purchase or registration process.
- Analyze general, wider-scope traffic flows.
- Analyze correlations between events on your site. Correlations display percentage of people who looked at your privacy policy went on to purchase a product.
Break down dimensions
Break down dimensions enable you to:
- Break down your data in unlimited ways for your specific needs.
- Break down metrics by dimension items or audience segments across selected time periods.You can also drill down further to a more granular level.
- Build queries using relevant metrics, dimensions, segments, timelines, and other analysis breakdown values.
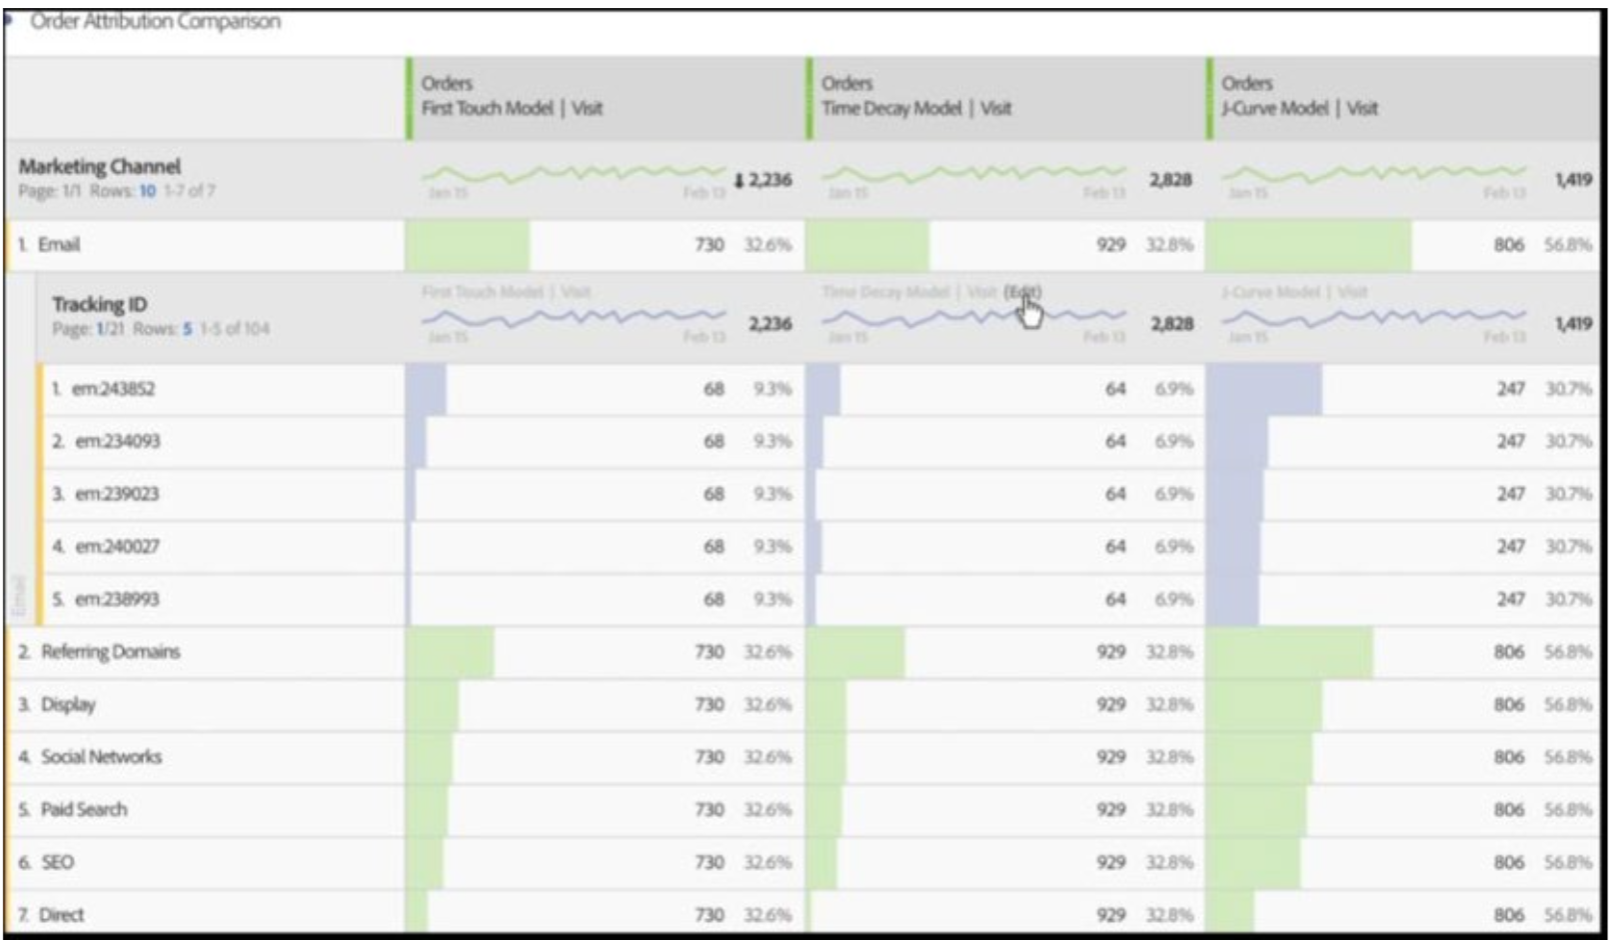
Any breakdown within a table can also have any attribution model applied to it. This attribution model can be the same or different from the parent column. For example, you can analyze linear orders on your marketing channels dimension but apply u-shaped orders to the specific tracking codes within a channel.
Note: - The number of breakdowns to show in the table is limited to 200. - This limit will increase for exporting breakdowns.
Create Basic and Advanced Reports
Scenario: With your Data View done in step 4 of the CJA Workflow, you can now create reports and data visualization to prove answers to questions about customer experience while interacting with your brand. We will cover some of the queries done in Module 7 - Query Service so you can see how easy is to run the same queries and more but without using SQL and relying only on the drag and drop philosophy of Analysis Workspace.
Tasks
Specifically, the reports and data visualization we will create in this will provides answers to the following questions:
- How many product views do we have on a daily basis?
- Top 5 Product Page by Page Name with events, session and people.
- Call center interaction Type by topics and call feeling.
- Product Interaction funnel, from viewing to buying.
- What do people do on the site before reaching the Cancel Service page?
- How are customers with a Positive Call center contact performing against the main  KPIs?
- Which Page Name (Product) shows the maximum number of events, sessions, and people.
Task 1: Create Analysis Report about How many product views do we have on a daily basis
-
Open CJA and click Projects on the top navigation bar. The available projects appear.
-
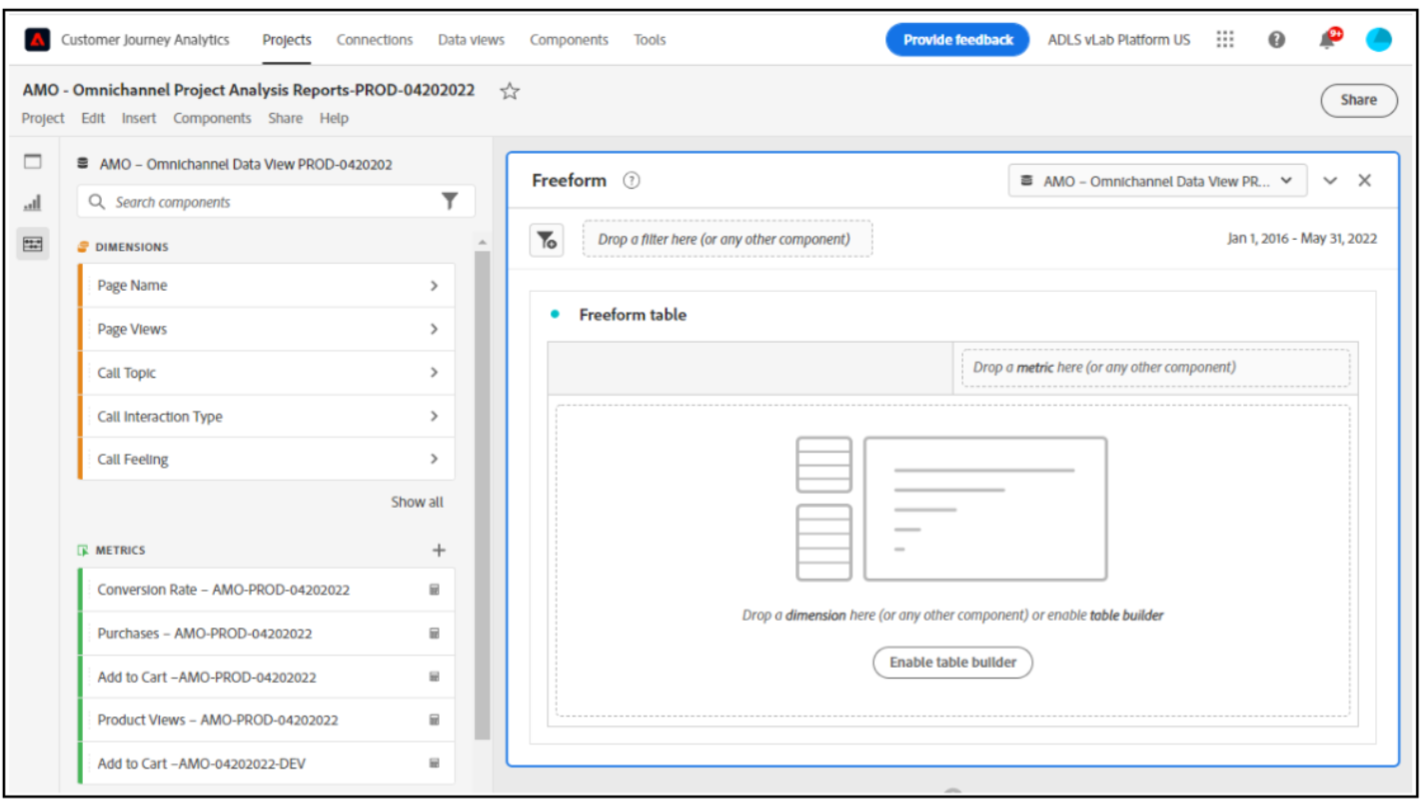
Click the project that you created in the previous exercise. For example, AMO - Omnichannel Project Analysis Reports. The Omnichannel Analysis project page open.
-
Find the Calculated Product View you created earlier from the Metrics list in the left trail. drag and drop it in to the canvas, on the top right with in the freeform table.
-
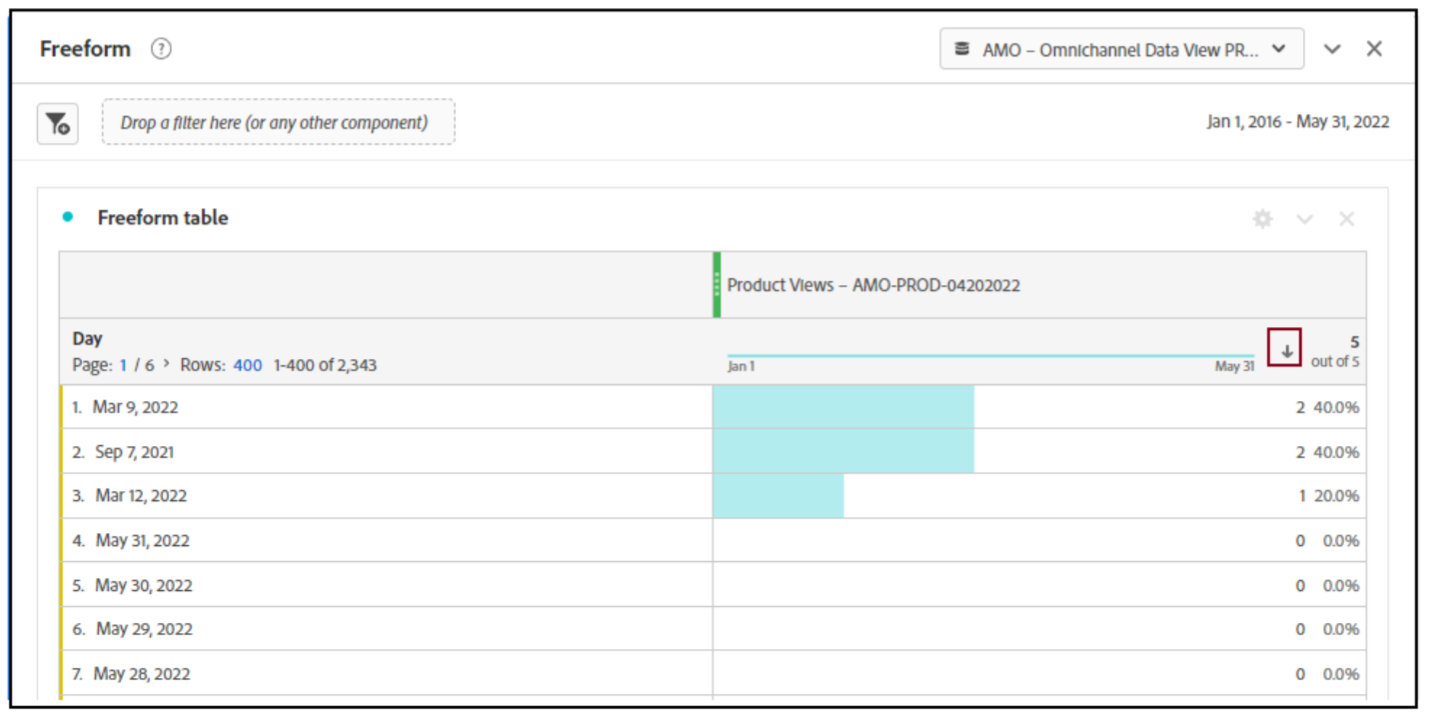
Automatically the dimension Day will be added to create your first table. Now you can see your question answered on the fly.
-
Click up arrow key on the right to the order of display from ascending to descending, as shown:
-
Create a Visualization report using the steps below:
-
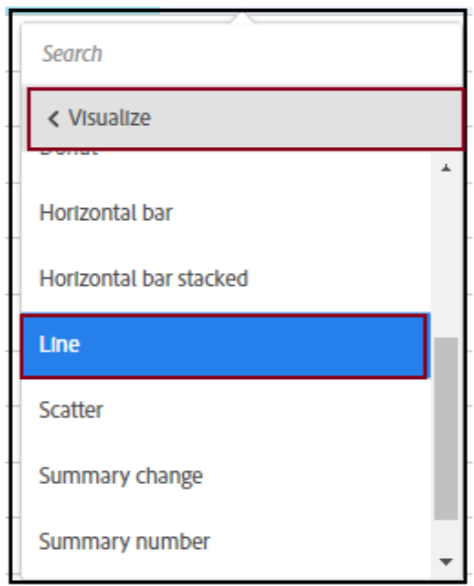
Right- click on the metric summary.
-
Click on Visualize and then select Line as visualization, as shown
-
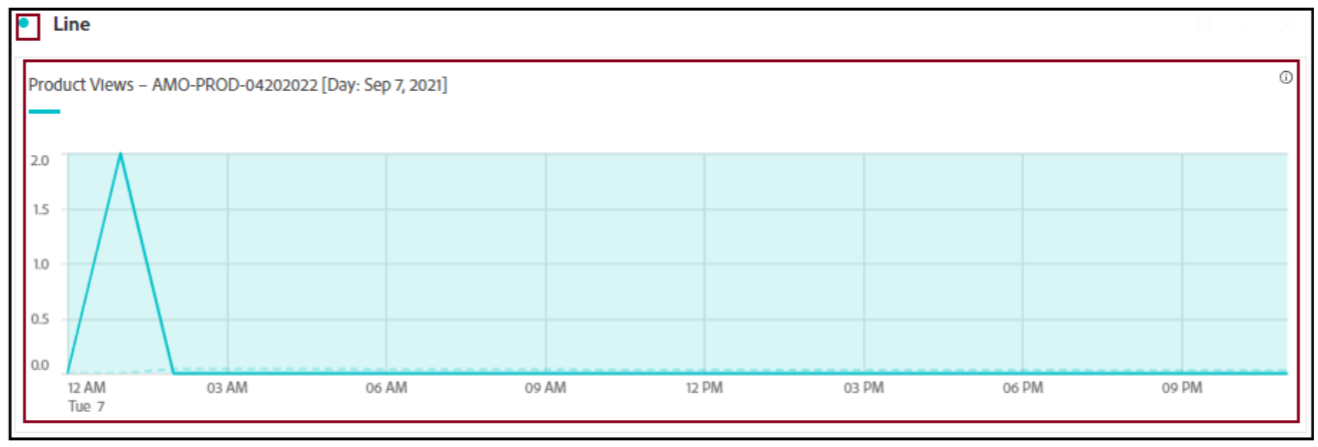
The Line graph displays, as shown:
-
The Line graph displays, as shown:
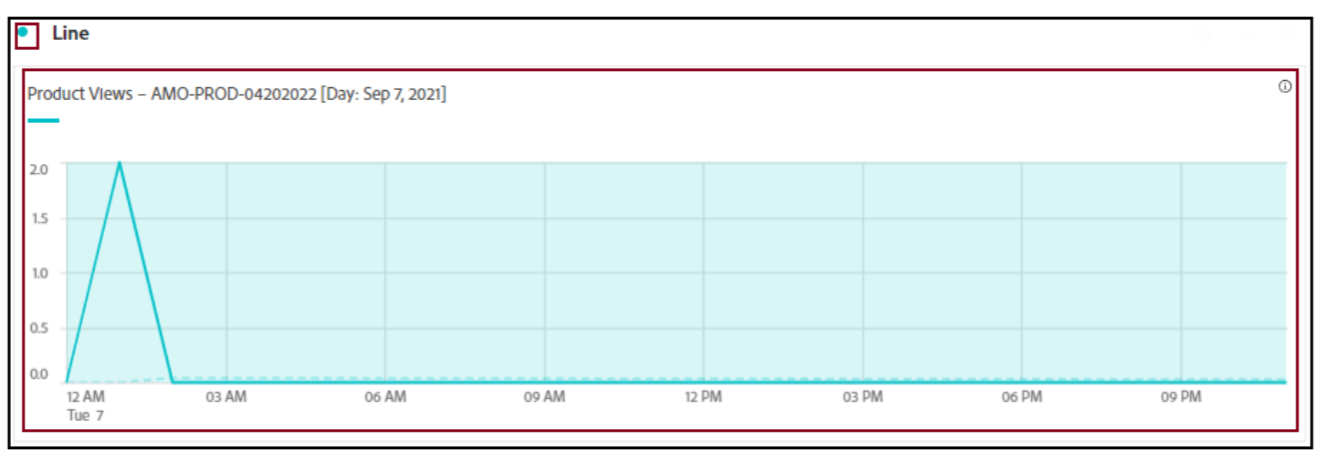
- Click Lock Selection and select Selected Items to lock this visualization so that it always displays a timeline of Product Views, as shown:
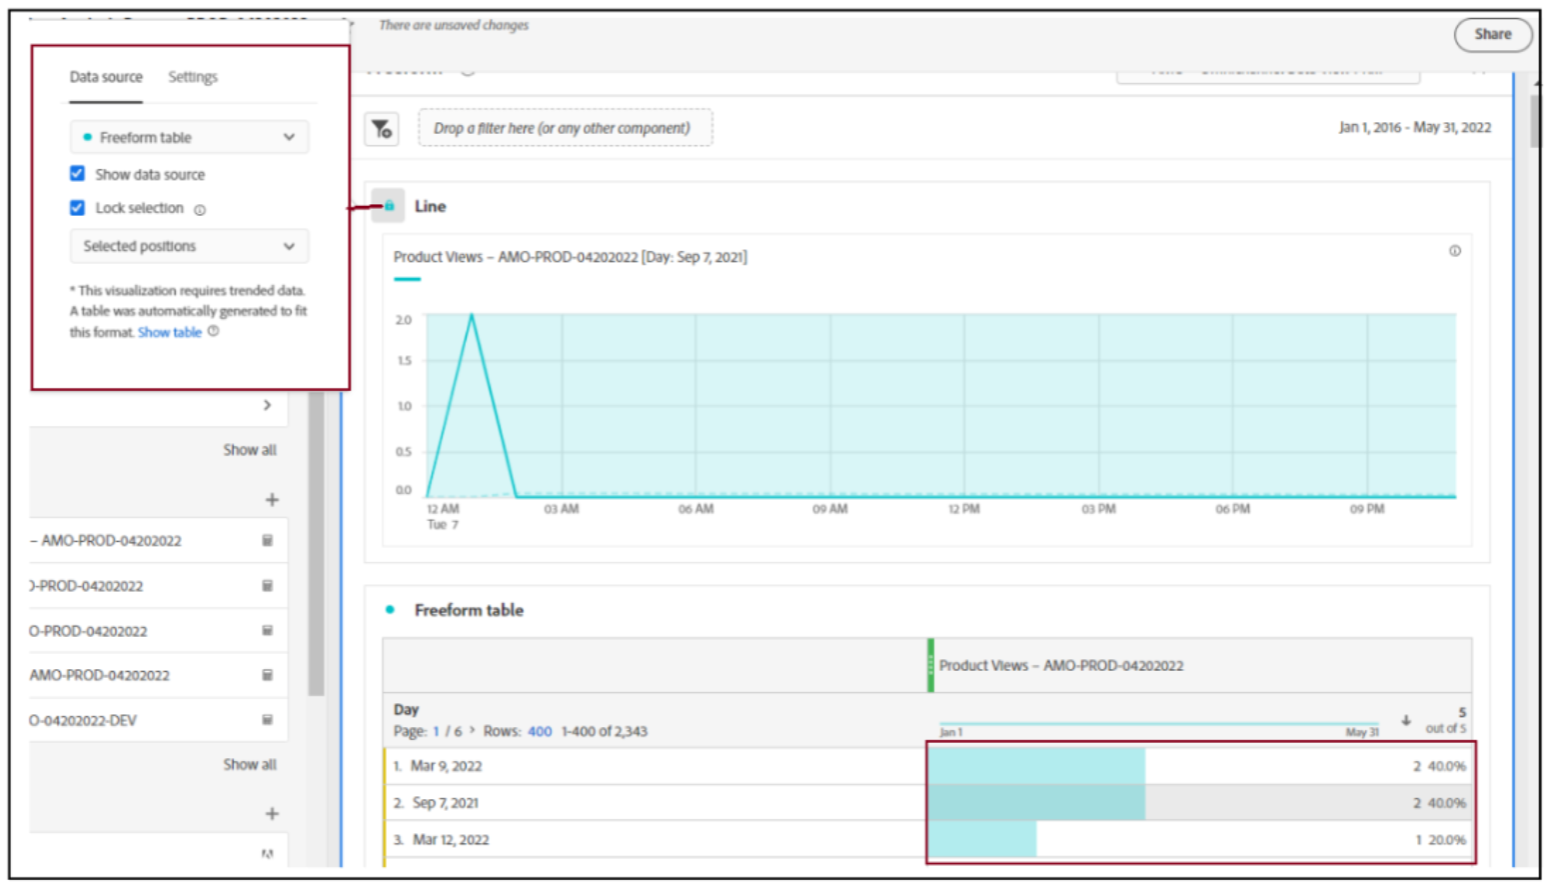
- Click the Freeform table name and type the text Daily Product Views.
- Save the Project. The Tabular report displays as shown:
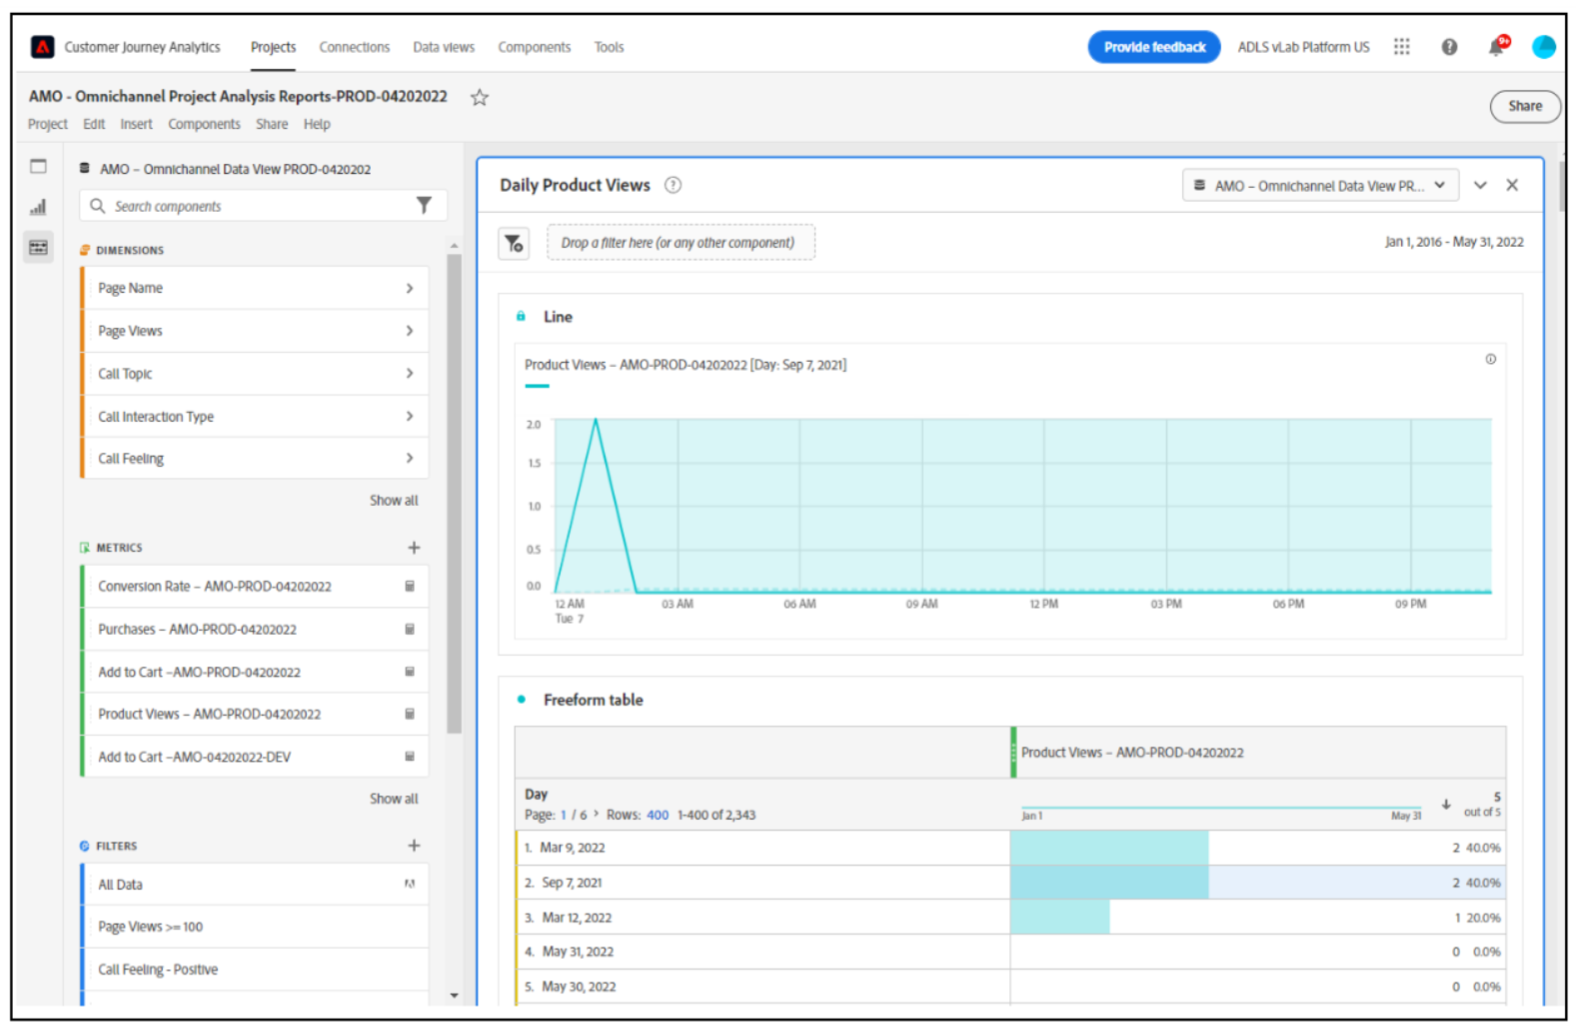
-
Task 2: Create Analysis Report for the Top 5 Product Page by Page Name with events,session and people
-
Confirm or change the calendar as follows:
- Start date: 2022-01-01.
- End Date: Current date.
- Set rolling date in the Advanced settings.
- Apply the changes to all panels
-
Navigate to the Insert > Freeform on the Project Menu bar to add a new Freeform Table.
-
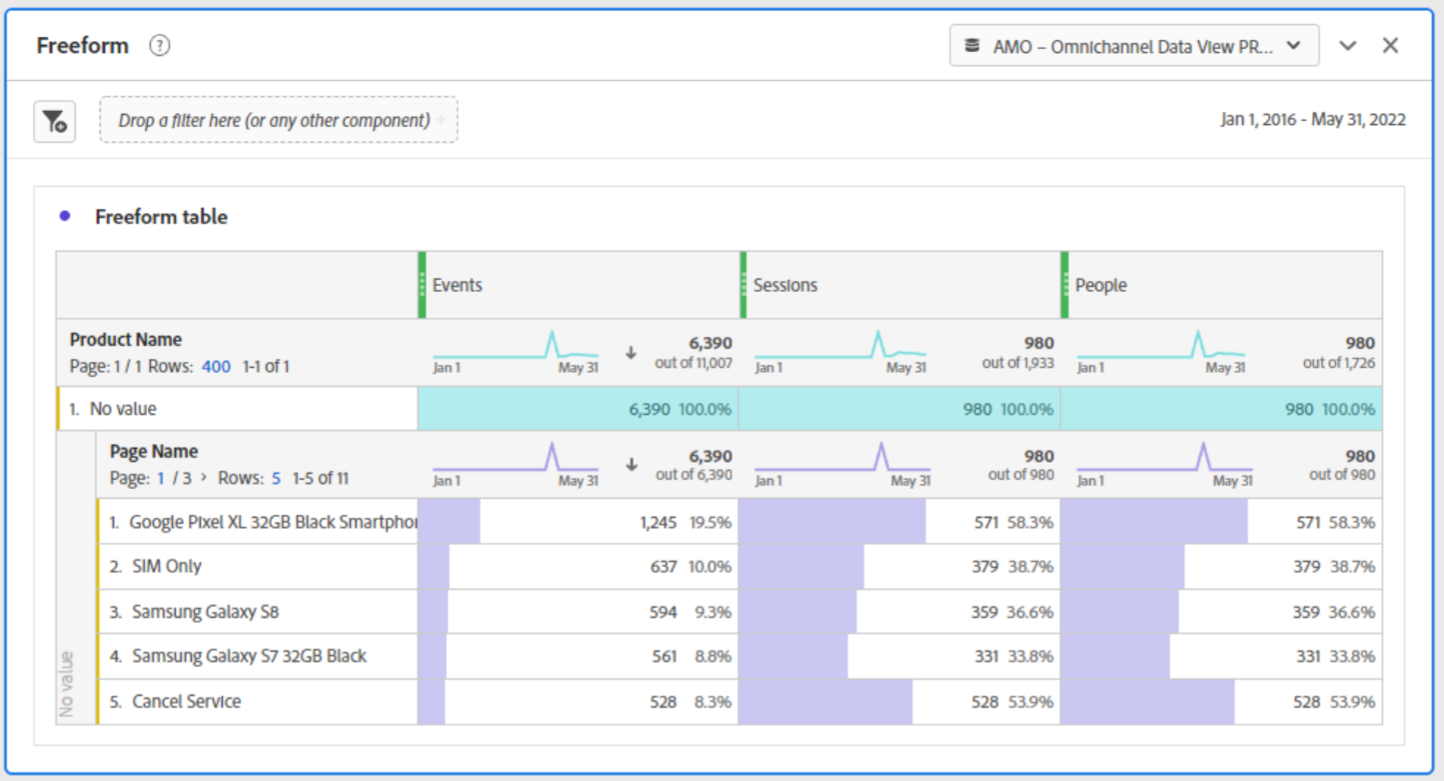
n the left side menu, find the Product Name – Dimension.
-
Drag and drop Product Name to replace onto the canvas of the Freeform. The result is as shown:
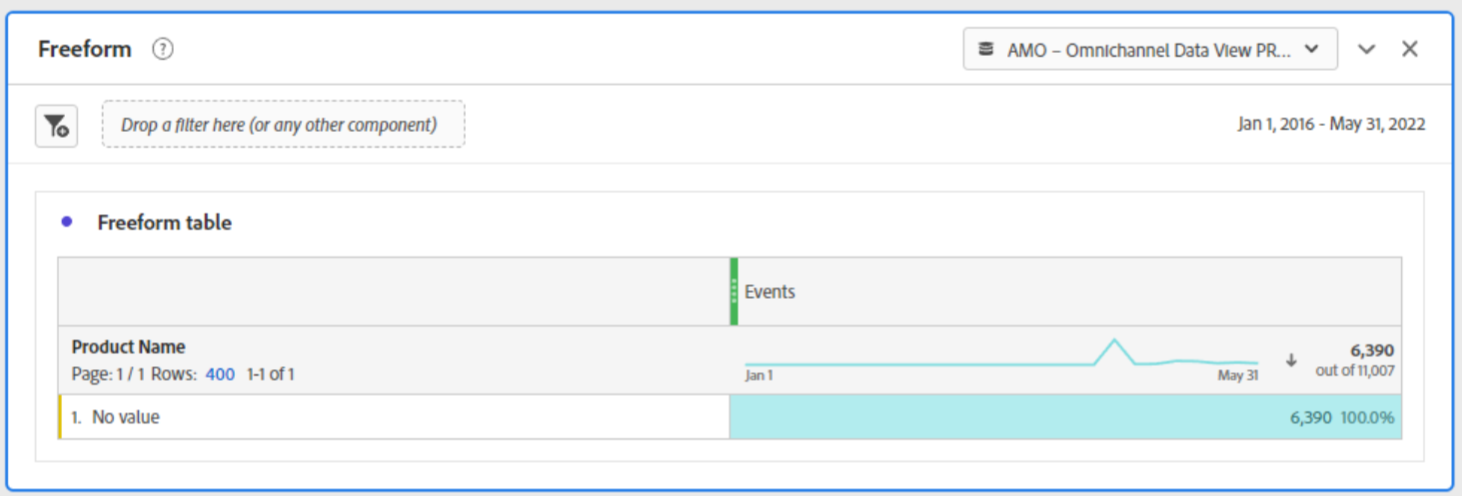
-
Right-click the value section of the Product Name dimension and navigate to Breakdown >Dimensions > Page Name. The result is as shown:
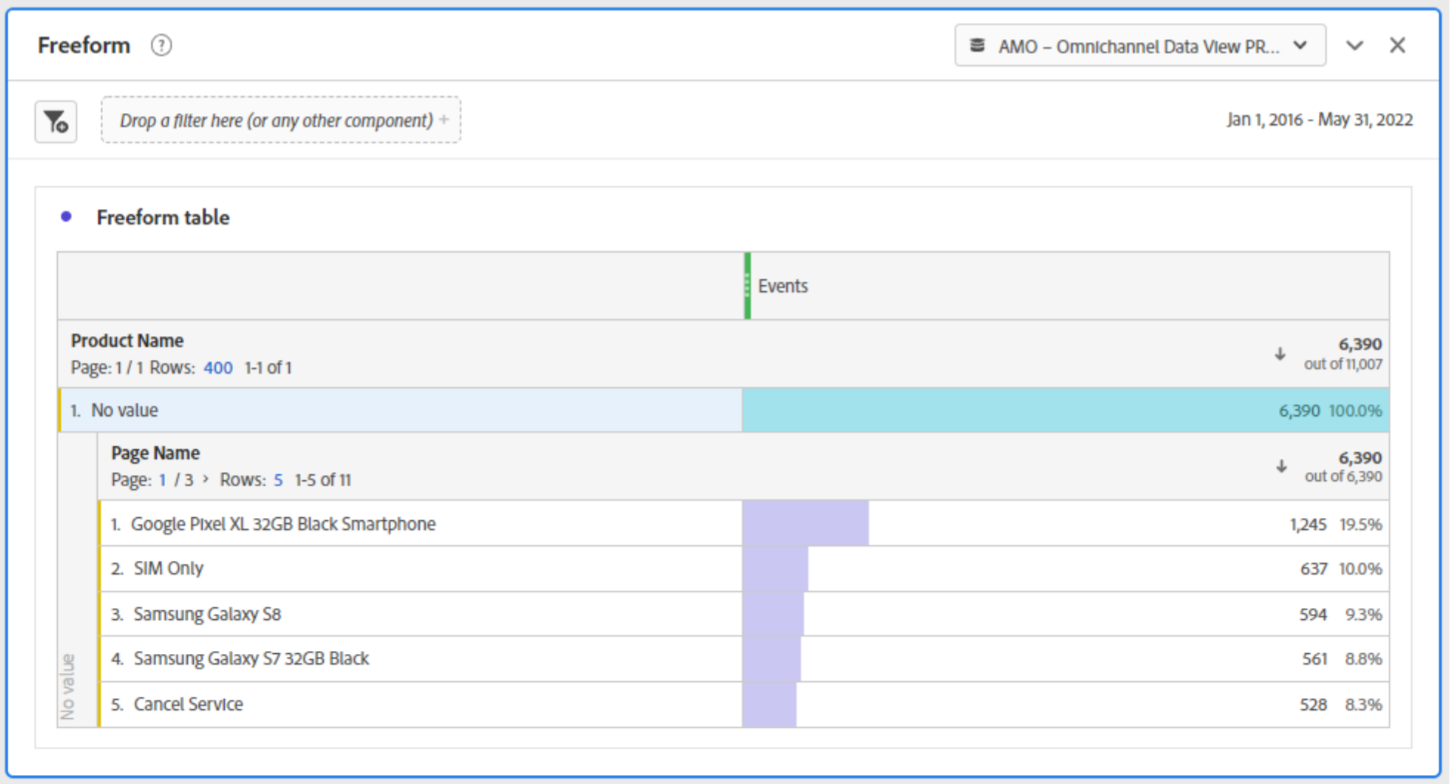
-
Add Sessions and People to the metrics section. The result is as shown:
-
Finally you can add more visualizations.
- Highlight the Page Name section of the Table.
- On the left side, under visualizations, search for Donut.
- Take Donut, drag-and- drop it on top of the table in the canvas. Visualization reports opens, as shown.
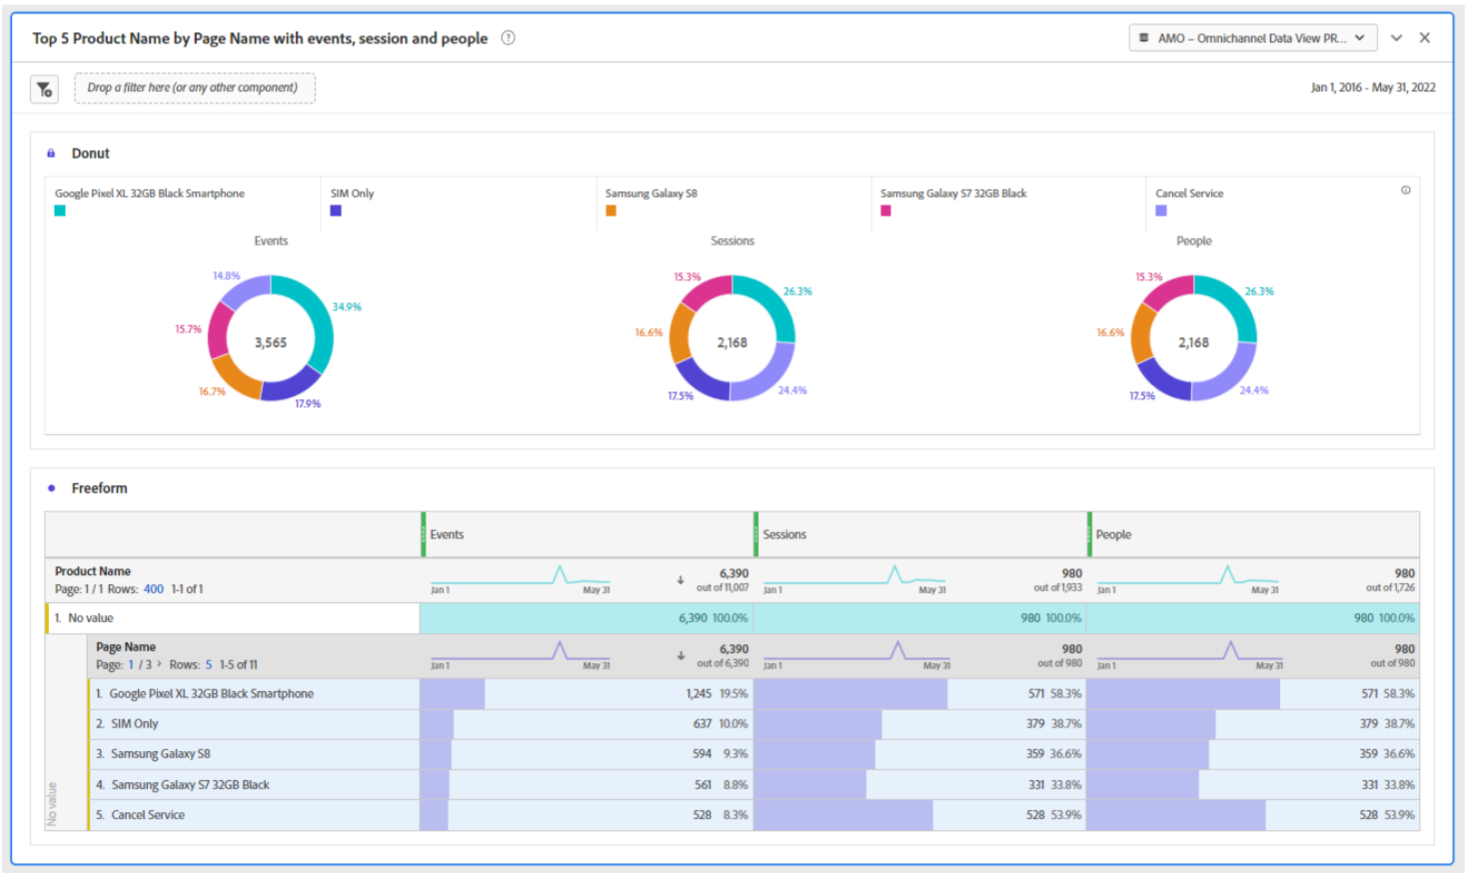
- Lock the Donut Visualization with the table.
- Name the report as Top 5 Product Name by Page Name with events, session and people.
- Save the Analysis Report.
Task 3: Create an Analysis Report for Call Center Interaction types
-
Add a New Freeform Table to the Basic Analysis Reports Panel
-
Configure the Calendar parameters as follows:
- Start date: 2022-01-01.
- End Date: Current date.
- Set rolling date in the Advanced settings.
- Apply the changes to all panels.
-
Move the New Freeform table to the bottom of the Panel.
-
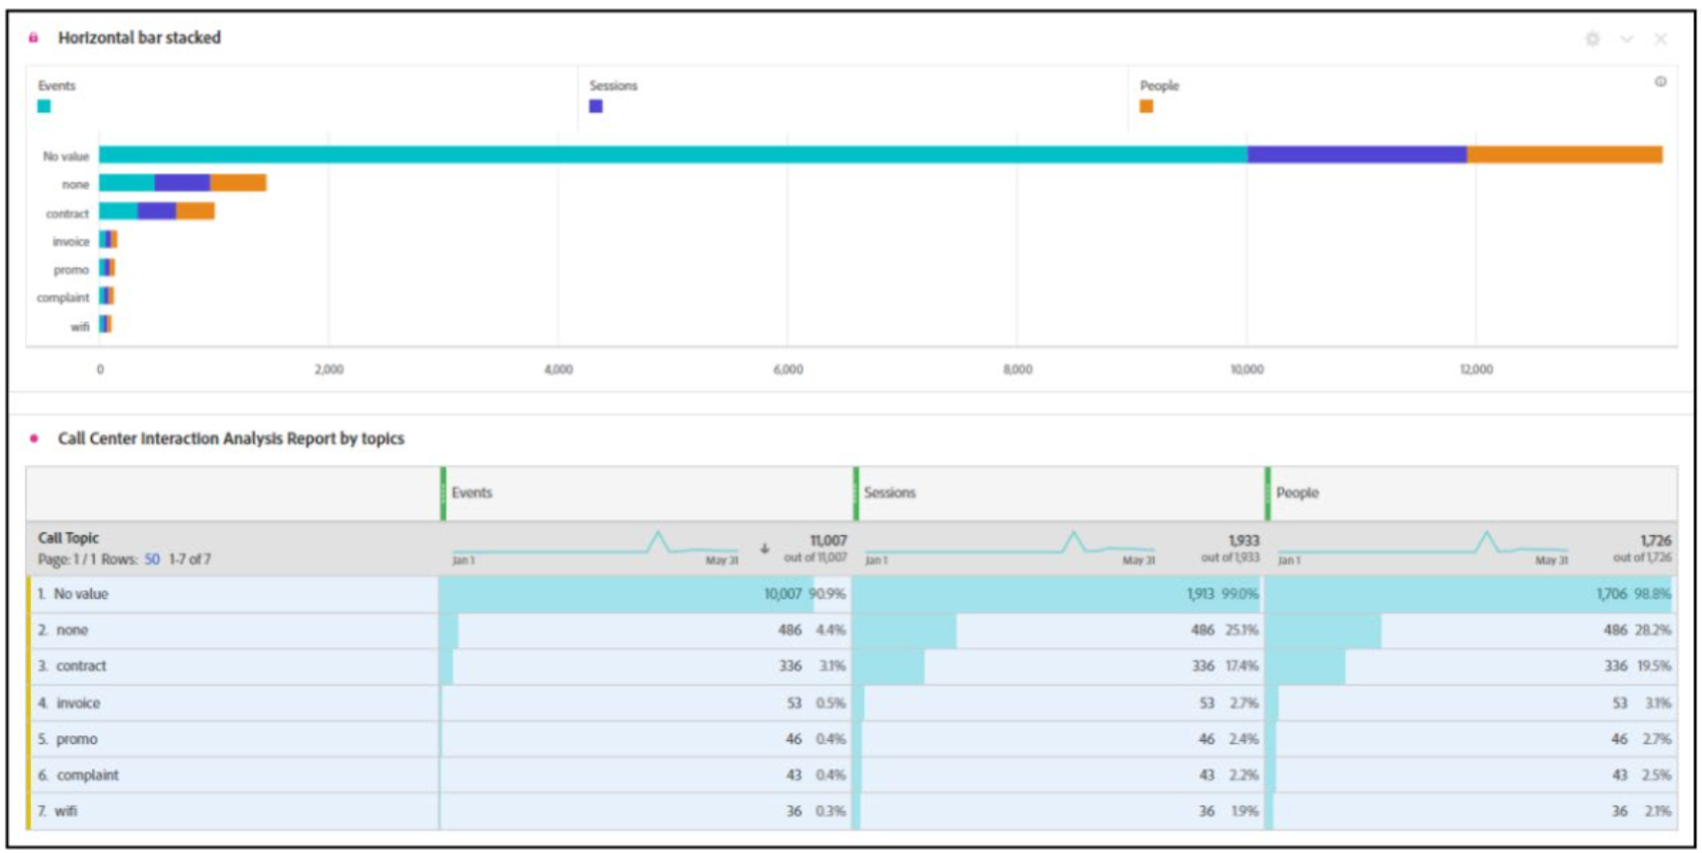
Drag and drop the Call Topic dimension over the Day dimension on the table.
-
Add Session and people the metrics sections. The results is as shown:
-
Name the report Call Center Interaction Analysis Report by topics
-
Gene rate a Horizontal Stack bar chart and lock the selected location.
-
Save the Project. The result is as shown below
Task 4: Product Interaction funnel, from viewing to buying
-
Add a new Panel below the Basic Analysis Reports pane
-
Configure the Calendar parameters as follows:
- Start date: 2022-01-01.
- End Date: Current date.
- Set rolling date in the Advanced settings.
- Apply the changes to all panels.
-
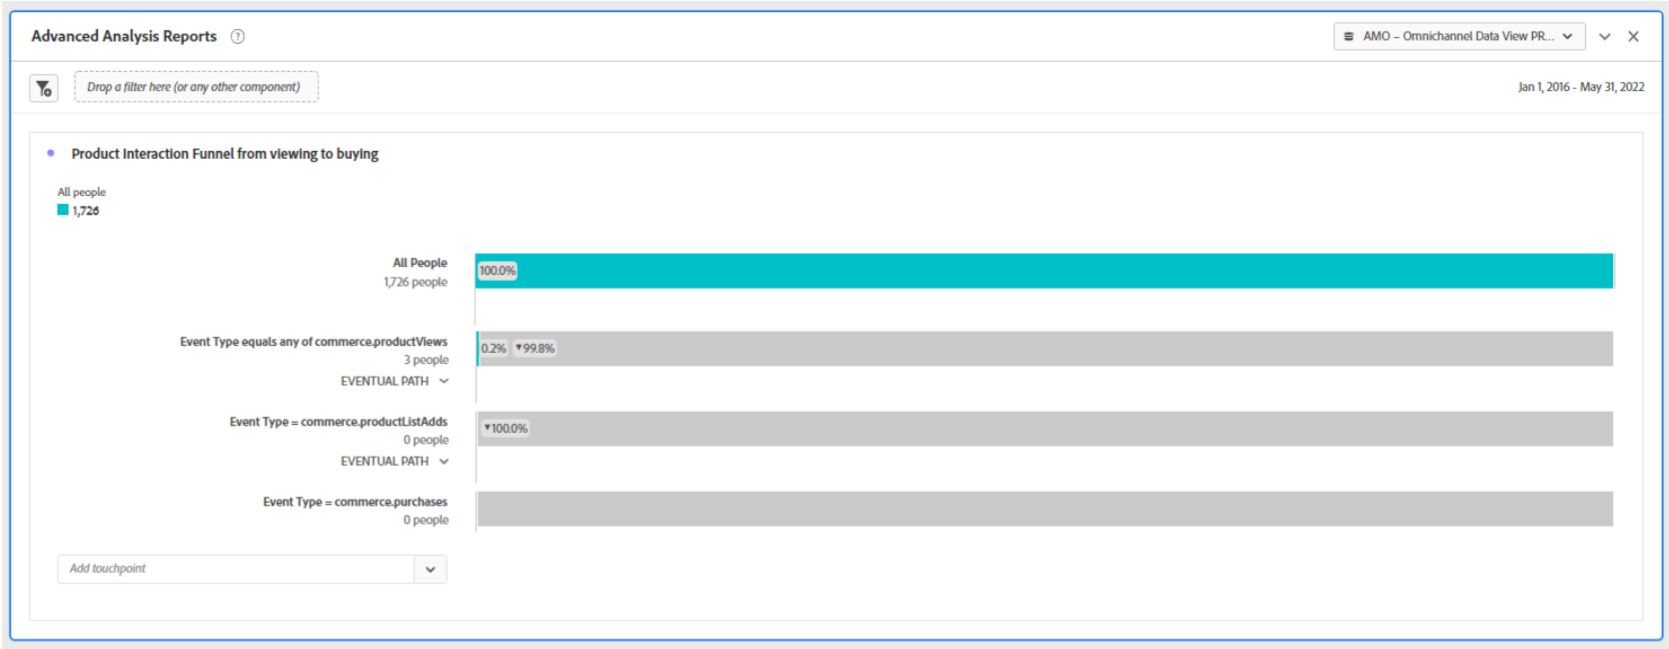
Click the visualization Fallout in the new panel and name it as Advanced Analysis Reports, as shown:

-
Drop the menu below the Add touch points and select Event Type > commerce.productViews.The result is as shown:

-
Repeat step 4 to add Event Type > commerce.productListAdds and commerce.purchases, as shown:
-
Add a Freeform in the Advanced Analysis Reports Panel for Page Name as shown:
-
Save the Analysis Project
Task 5 : What do people do on the site before reaching the Cancel Service pag
Flow diagrams:
- Shows customer paths through your websites and  applications.
- Visualize the customer journey through your website or application.
- Analyze where customers go before and after specified checkpoints, such as entry, a  specific dimension, or  exit.
-
Make the Advance Analysis Reports your focus panel.
-
Click on the Visualization Object in the top left tra
-
Drag and drop Flow diagram from the list below the fallout report. The flow diagram windows opens.

-
Select the component tab in the left trail and search for Page Name Dimension.
-
Drag and drop the Page Name Dimension onto the Dimension or item in the middle of the flow diagram. The flow diagram displays the page flow, as shown:
